Grafana 強大的地方在於支援多種資料來源以及豐富的面板選擇,幫助我們可視化所需資訊。本篇就來實際操作看看,建立屬於自己的 Grafana Dashboard。
接續 Day21 ,請在 Istio 環境安裝好 Grafana ,接著就可以開始實作。
Dashboard -> New dashboard
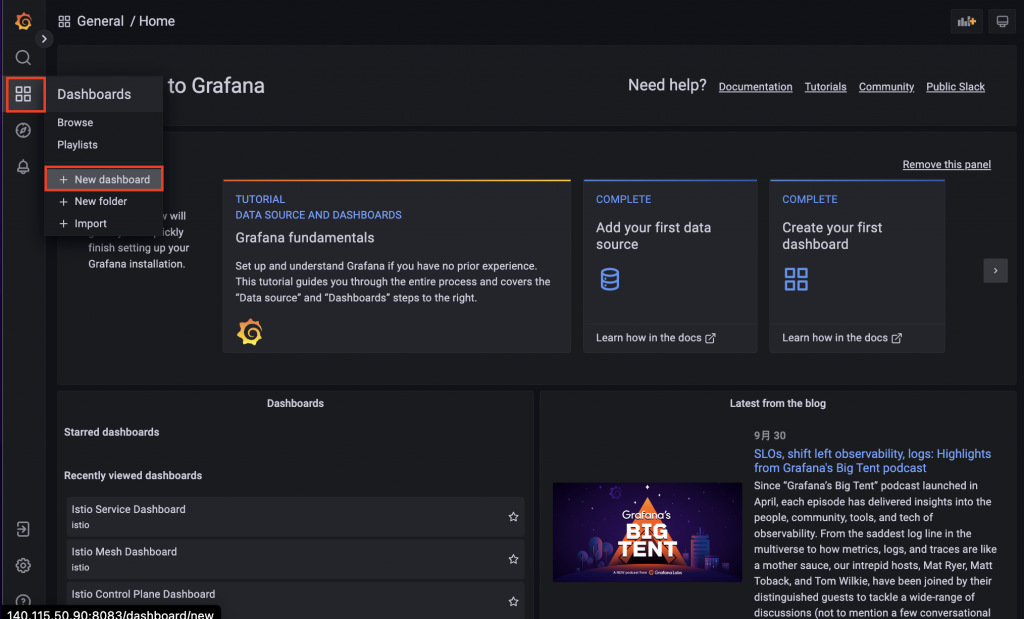
Dashboard 是由多個 Panel 組合而成的,一個 Panel 負責呈現一組數據,在 Grafana 提供不同的 Panel 如 Stat Panel、Time Series Panel、Table Panel,首先我們先從最簡單的 Stat Panel 開始建置。
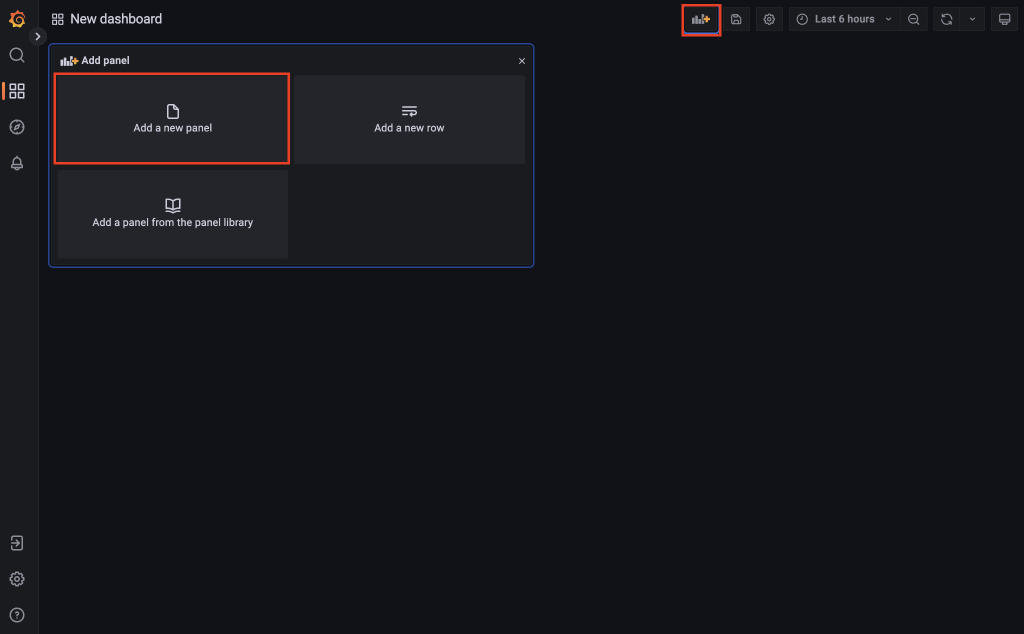
Add Panel,接著點擊 Add a new panel
Stat Panel 能夠呈現一個數字在 Dashboard 上,試著呈現 Prometheus 的版本號。
3.搜尋 Metrics 為prometheus_build_info 資料,並在 Options -> Fromat 選擇 Table
prometheus_build_info
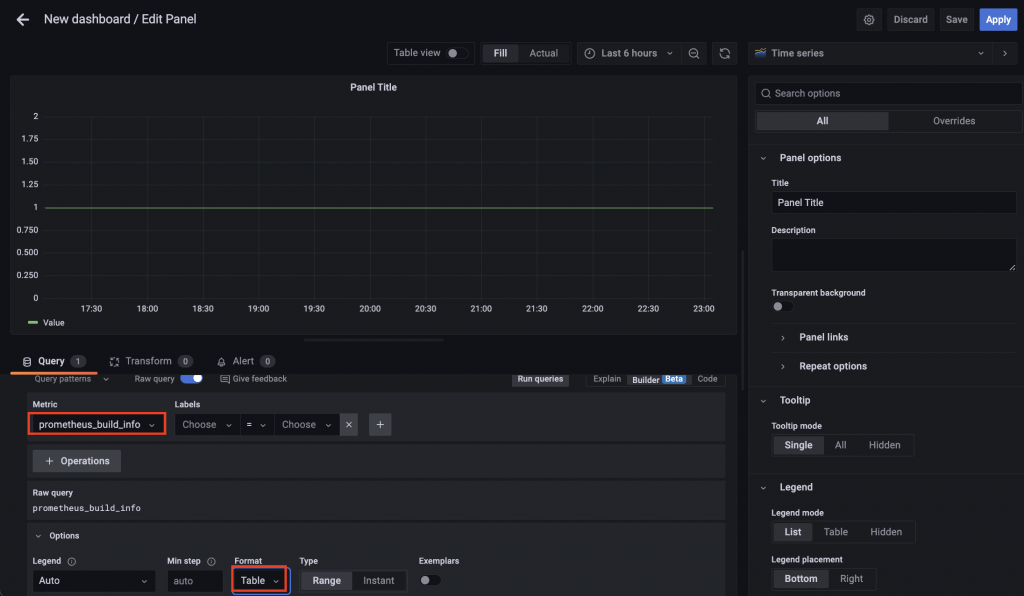
在 prometheus_build_info 的 Metrics 內含 Prometheus 版本資料
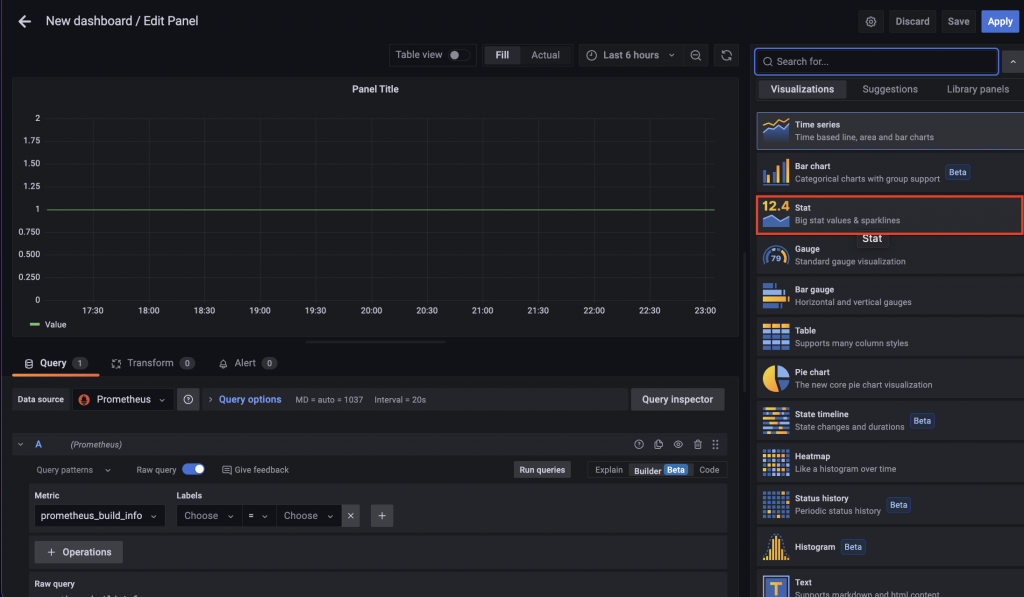
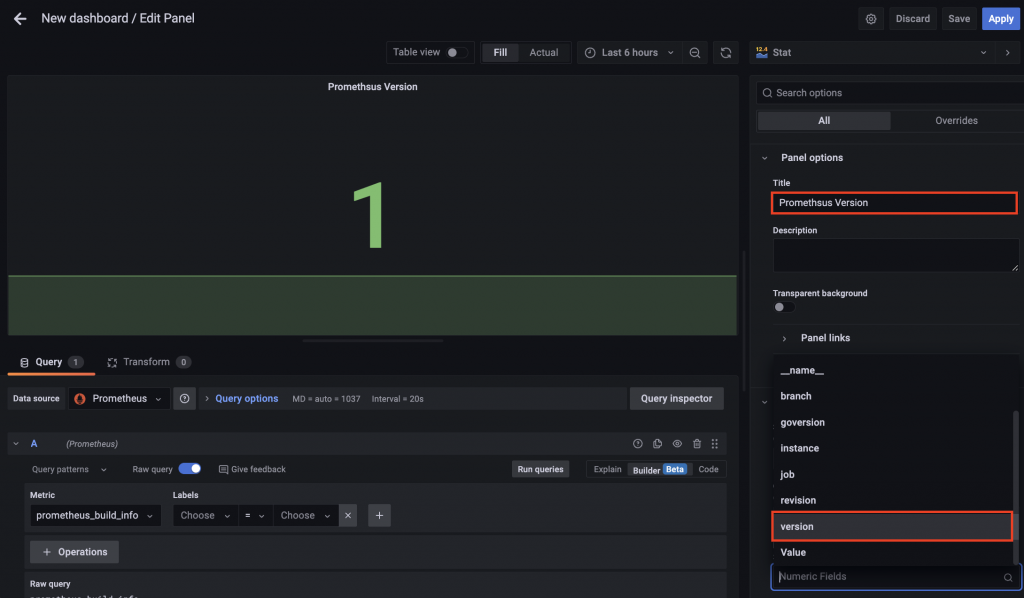
再來將可視化的方式設定為 stat Panel
Change visualization,選擇 Stat
prometheus_build_info 有好幾個欄位的資料,所以需要指定特定欄位。
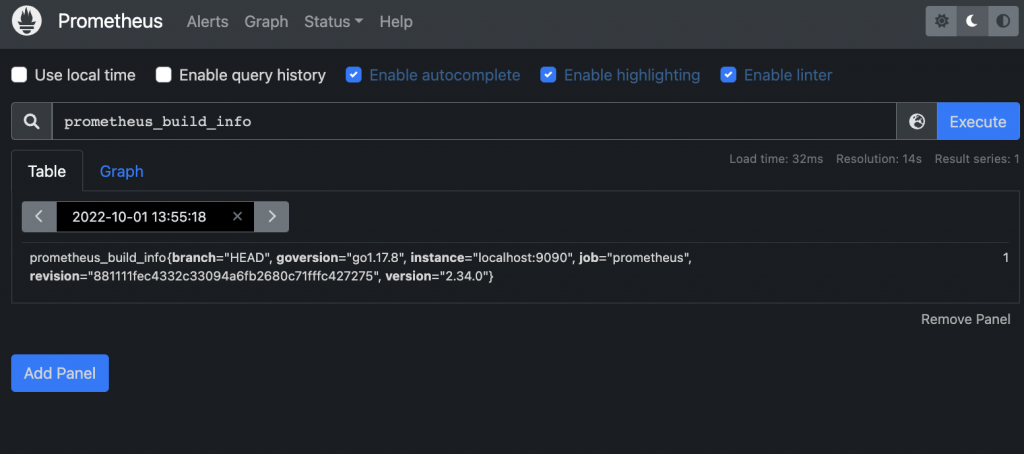
在 prometheus GUI Query
prometheus_build_info的結果
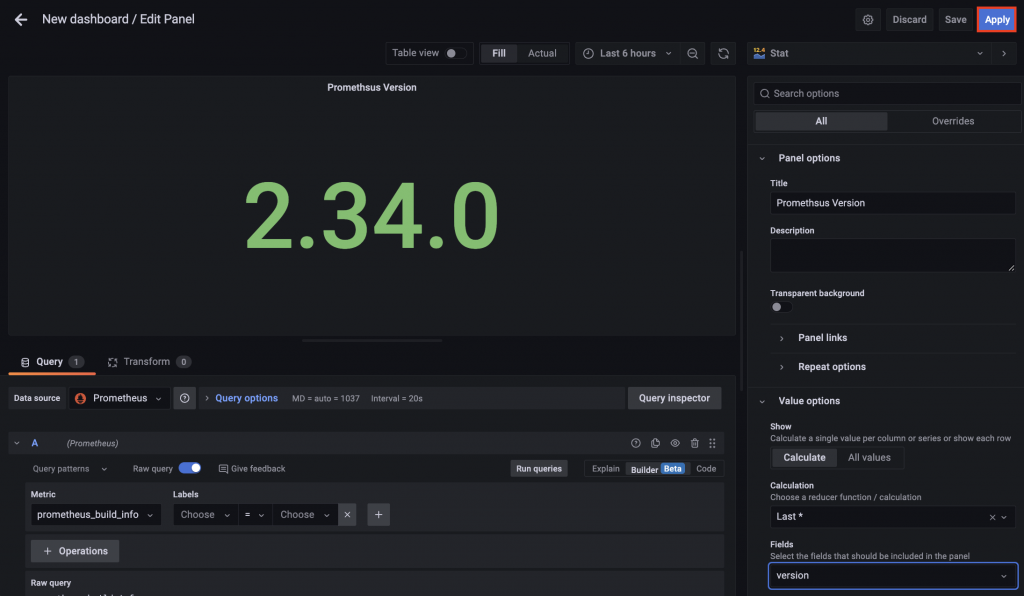
Promethsus Version
在 Stat Panel 即可看到版本號。
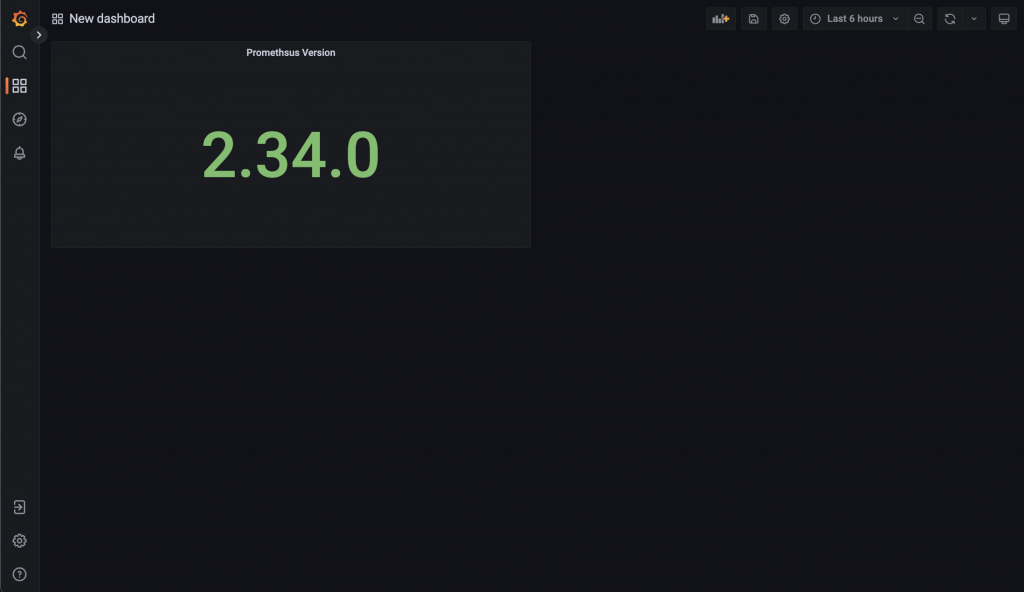
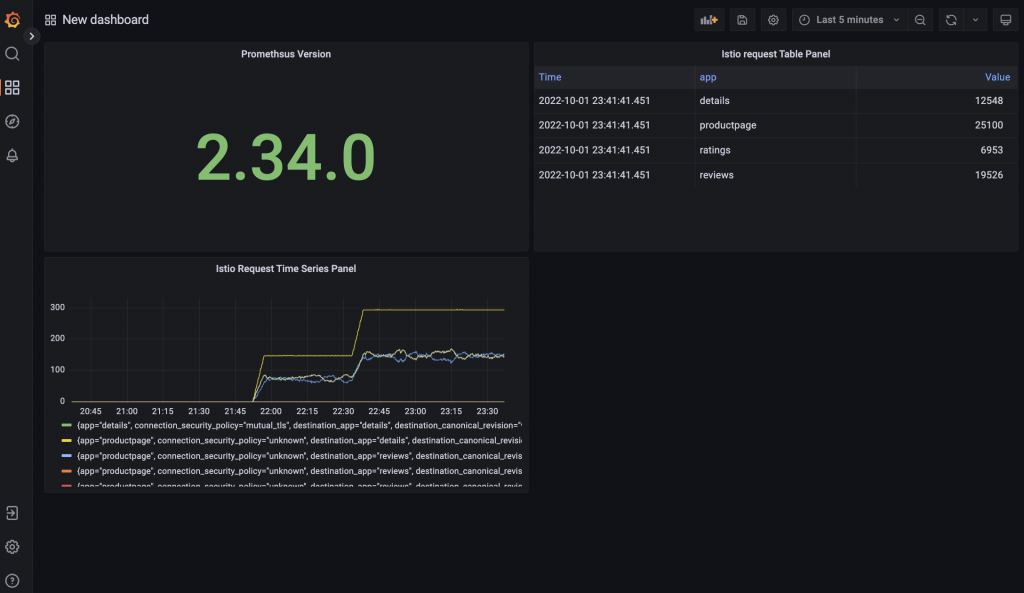
在 Dashboard 即可看到新的 Panel。
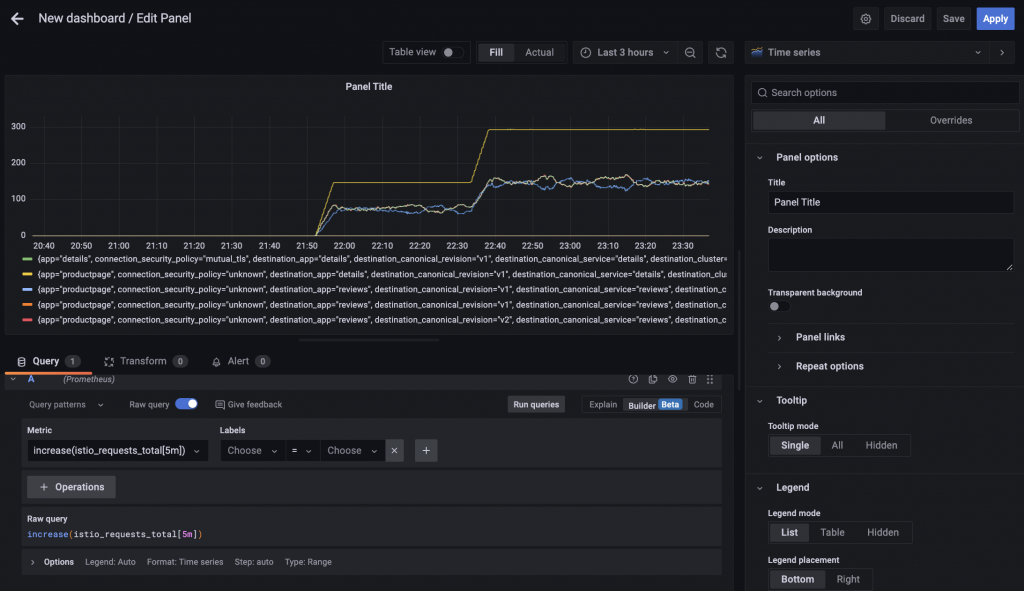
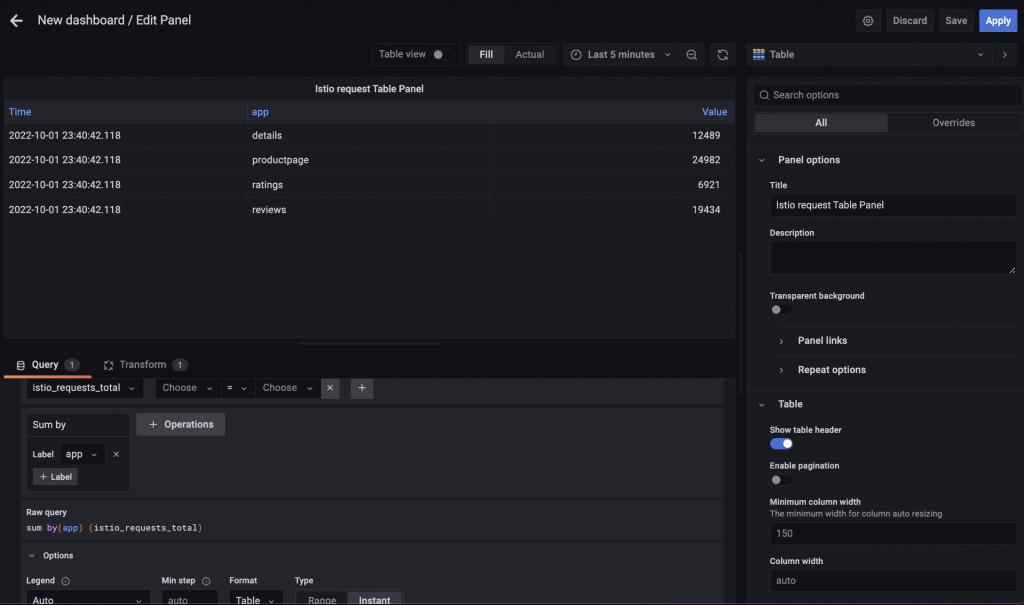
若需建立不同種類的 Panel ,可以依照上面的流程,先利用 PromQL 語法 Query 所需資料的 Metrics,接著在 Grafana 設定需要哪種面板選擇,有哪些資料需要哪些被顯示,即可完成屬於自己的 Panel,下面是筆者自己的嘗試,可以試著做做看。
increase(istio_requests_total[5m])
sum by(app) (istio_requests_total)
學會使用 Grafana,就能輕鬆做出屬於自己的 Dashboard。


 iThome鐵人賽