以PyTorch實作循環神經網路模型(迴歸)
- 訓練所需的數據
以sin函數的曲線預測出cos函數的曲線
import torch
from torch import nn
import numpy as np
import matplotlib.pyplot as plt

torch.manual_seed(1)

TIME_STEP = 10
INPUT_SIZE = 1
LR = 0.05
DOWNLOAD_MNIST = False
- RNN模型(迴歸)
class RNN(nn.Module):
    def __init__(self):
        super(RNN, self).__init__()

        self.rnn = nn.RNN(
            input_size=1,
            hidden_size=32,
            num_layers=1,
            batch_first=True,
        )
        self.out = nn.Linear(32, 1)

    def forward(self, x, h_state):
        r_out, h_state = self.rnn(x, h_state)
        outs = []
        for time_step in range(r_out.size(1)):
            outs.append(self.out(r_out[:, time_step, :]))
        return torch.stack(outs, dim=1), h_state

rnn = RNN()
print(rnn)
- 訓練
optimizer = torch.optim.Adam(rnn.parameters(), lr=LR)
loss_func = nn.MSELoss()

h_state = None

for step in range(200):
    start, end = step * np.pi, (step+1)*np.pi
    steps = np.linspace(start, end, 10, dtype=np.float32)
    x_np = np.sin(steps)
    y_np = np.cos(steps)

    x = torch.from_numpy(x_np[np.newaxis, :, np.newaxis])
    y = torch.from_numpy(y_np[np.newaxis, :, np.newaxis])

    prediction, h_state = rnn(x, h_state)

    h_state = h_state.data

    loss = loss_func(prediction, y)
    optimizer.zero_grad()
    loss.backward()
    optimizer.step()
- 以一個標示有X,Y軸的座標進行呈現
 plt.plot(steps, y_np.flatten(), 'r-')
    plt.plot(steps, prediction.data.numpy().flatten(), 'b-')
    plt.draw(); plt.pause(0.05)

plt.ioff()
plt.show()
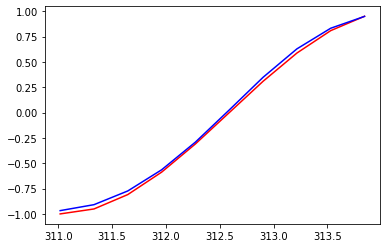
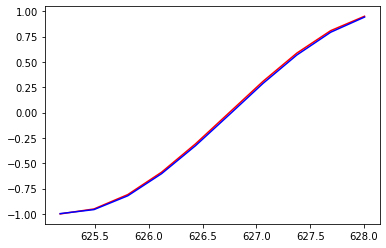
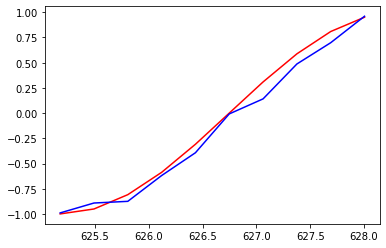
- 在不同的學習率及range下,得到的結果圖會有所不同:
- 學習率=0.01,range=100

- 學習率=0.01,range=200

- 學習率=0.05,range=200

由上面的三個圖表可以得知range只會影響X座標最終的繪圖到哪個值,而學習率的部分則必須要好好選擇,學習率差個0.01可能就會導致迴歸模型不是那麼的完美.
參考資料:


