今天我們要用python來實作Random Forest,今天一樣要用到sklearn的iris資料集,但這次我們只用萼片長度(sepal length (cm))、萼片寬度(sepal width (cm))來當特徵(feature)。x取用data.data的第0個欄位和第1個欄位,分別就是萼片長度(sepal length (cm))和萼片寬度(sepal width (cm)) 。讀者們也可以試試看用別的欄位,第3個欄位是花瓣長度(petal length (cm))、第4個欄位是花瓣寬度(petal width (cm))。
from sklearn import datasets

data = datasets.load_iris()
x = data.data[:, [0, 1]]
y = data.target
在載入完資料過後,用sklearn的train_test_split將資料分成訓練集以及測試集。筆者這邊訓練集和測試集的比例為7:3,讀者們也可以試試看不同的比例。
from sklearn.model_selection import train_test_split

x_train, x_test, y_train, y_test = train_test_split(x, y, test_size = 0.3, random_state = 42)
接著要建構模型,我們直接用sklearn裡的RandomForestClassifier函式建構Random Forest。建構完成過後,直接將訓練集資料給丟進模型去做訓練。
from sklearn.ensemble import RandomForestClassifier

random_forest = RandomForestClassifier()
random_forest.fit(x_train, y_train)
訓練完成過後,可以用score函式看看準確度,筆者這邊訓練完獲得的準確度是77.8%左右。
random_forest.score(x_test, y_test)
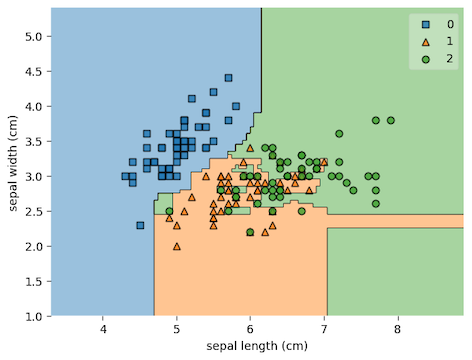
最後,我們可以用mlxtend.plotting裡的plot_decision_regions函式,直接看看分類的實際圖長什麼樣子。
import matplotlib.pyplot as plt
from mlxtend.plotting import plot_decision_regions

plot_decision_regions(x, y, clf = random_forest)
plt.xlabel("petal length (cm)")
plt.ylabel("petal width (cm)")
plt.show()