完成科技類股的分類板塊
(共三個層級:科技-sector-industry)
<script setup>
const stockByVolumeApi = computed(() => {
  return `https://financialmodelingprep.com/api/v3/quote/${stockName.value}?apikey=${fmp}`
})

const stockByVolume = ref([])

const stockFullData = computed(() => {
  const data =
    stockByVolume.value.length !== 0
      ? stockByVolume.value.map((volume) => {
          let matchSymbol = technologyStock.value.find(
            (v) => v.symbol === volume.symbol
          )
          if (matchSymbol) {
            volume.sector = matchSymbol.sector
            volume.industry = matchSymbol.industry
          }
          return volume
        })
      : undefined
  return data
})

const chartData = computed(() => {
  const data = stockFullData.value
    ? stockFullData.value.map((v) => {
        return {
          id: v.name,
          name: `${v.symbol} ${v.changesPercentage} %`,
          colorValue: v.changesPercentage,
          parent: v.industry,
          value: v.volume,
        }
      })
    : undefined
  const industry = stockFullData.value
    ? new Set(
        stockFullData.value.map((v) => {
          return v.industry
        })
      )
    : undefined
  const sector = stockFullData.value
    ? new Set(
        stockFullData.value.map((v) => {
          return v.sector
        })
      )
    : undefined

  const level1 = sector
    ? [...sector].map((v) => {
        const data = {
          id: v,
          name: v,
          color: 'transparent',
        }
        return data
      })
    : undefined

  const level2 = industry
    ? [...industry].map((v) => {
        const data = {
          id: v,
          name: v,
          parent: 'Technology',
          color: 'transparent',
        }
        return data
      })
    : undefined
  console.log(level2)
  const fullData = data ? [...level1, ...level2, ...data] : undefined
  return fullData
})

watchEffect(() => {
  if (stockName.value) {
    axios
      .get(stockByVolumeApi.value)
      .then((res) => {
        console.log(res)
        stockByVolume.value = res.data
      })
      .catch((rej) => {
        console.log(rej)
      })
  }
})

const chartOptions = computed(() => {
  return chartData.value
    ? {
        chart: {
          height: '800px',
        },
        colorAxis: {
          // minColor: '#F63538',
          // maxColor: '#30cc5a',
          max: 3,
          min: -3,
          stops: [
            [0, '#F63538'],
            [0.16, '#bf4045'],
            [0.33, '#8b444e'],
            [0.5, '#414554'],
            [0.66, '#35764e'],
            [0.82, '#2f9e4f'],
            [1, '#30cc5a'],
          ],
        },
        plotOptions: {
          treemap: {
            states: {
              hover: {
                enabled: false, // 關閉 hover 效果
                brightness: 0, // 確保沒有亮度變化
                borderColor: 'transparent', // 設定邊框顏色為透明
              }
            }
          }
        },
        series: [
          {
            name: 'Tech',
            type: 'treemap',
            layoutAlgorithm: 'squarified',
            allowDrillToNode: true,
            animationLimit: 1000,
            levels: [
              {
                level: 1,
                //第一層標籤
                dataLabels: {
                  enabled: true,
                  align: 'left', // 左對齊
                  verticalAlign: 'top', // 置於區塊的最上方
                  fontSize: '14px',
                  textOutline: false,
                  borderWidth: 5,
                  backgroundColor: 'black',
                  style: {
                    fontSize: '12px',
                    textOutline: false,
                    color: 'white',
                    textOverflow: 'pre-wrap',
                    whiteSpace: 'nowrap',
                    width: '100%', // 設定寬度為 100%
                    textOverflow: 'ellipsis', // 如果文本超出,則使用省略號
                  },
                  width: '100%',
                },
                color: 'transparent',
                borderWidth: 1,
                borderColor: '#363a46',
                levelIsConstant: false,
              },
              {
                level: 2,
                dataLabels: {
                  align: 'left', // 左對齊
                  verticalAlign: 'top', // 置於區塊的最上方
                  enabled: true,
                  style: {
                    fontSize: '12px',
                    textOutline: false,
                    color: 'white',
                    textOverflow: 'pre-wrap',
                  },
                },
                color: 'transparent',
                borderColor: '#363a46',
              },
              {
                level: 3,
                dataLabels: {
                  useHTML: true,
                  formatter: function () {
                    // 檢查框框的面積
                    if (
                      this.point.shapeArgs.width * this.point.shapeArgs.height <
                      3000
                    ) {
                      return null // 不顯示 dataLabel
                    }
                    return this.point.name
                  },
                  enabled: true,
                  align: 'center', // 左對齊
                  verticalAlign: 'middle', // 置於區塊的最上方
                  style: {
                    fontSize: '12px',
                    textOutline: false,
                    color: 'white',
                    textOverflow: 'pre-wrap',
                  },
                },
                borderColor: '#363a46',
                color: 'transparent',
              },
            ],
            accessibility: {
              exposeAsGroupOnly: false,
            },
            data: chartData.value,
          },
        ],
        subtitle: {
          text: 'Software—Infrastructure',
          align: 'left',
        },
        title: {
          text: '股票熱區地圖',
          align: 'left',
        },
      }
    : undefined
})
</script>
原本取得的資料stockByVolume只有即時報價跟交易量
但沒有它是哪個種類(sector)及產業(industry)的分類
透過array方法map跟find加入後完成
再來要給圖表的資料chartdata
首先先把sector跟indusrty有幾個分類先給找出來
先透過map取出後
在利用new Set這個物件的特性(不會新增重複的元素)
取到sector跟industry
然後再分出level1,level2及level3的資料(data)即可
接著調整圖表
首先是圖表hover都會有一層薄霧(中間的AAPL)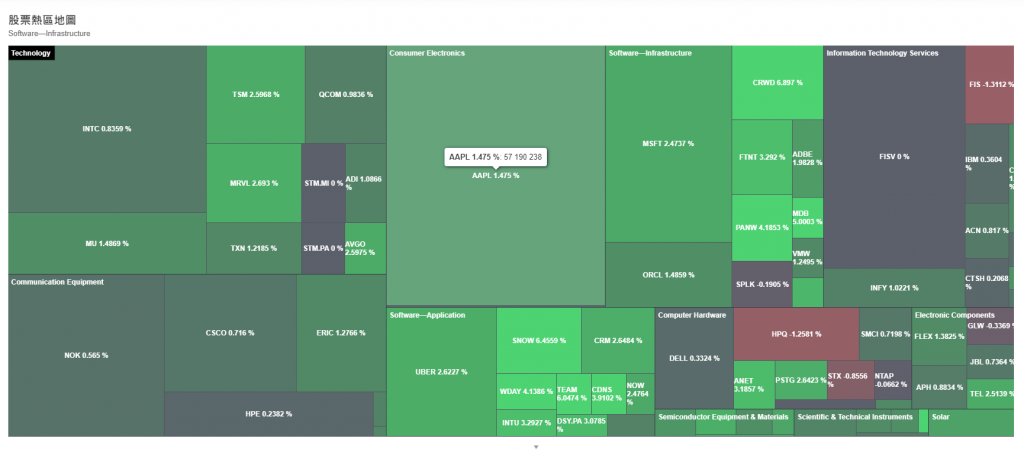
然後圖層本身也有
導致色差變得有點嚴重
所以先在chartdata裡第一層跟第二層的資料多加一個color: 'transparent'使其透明
再到plotOptions底下調整hover效果
plotOptions: {
          treemap: {
            states: {
              hover: {
                enabled: false, // 關閉 hover 效果
                brightness: 0, // 確保沒有亮度變化
                borderColor: 'transparent', // 設定邊框顏色為透明
              },
},
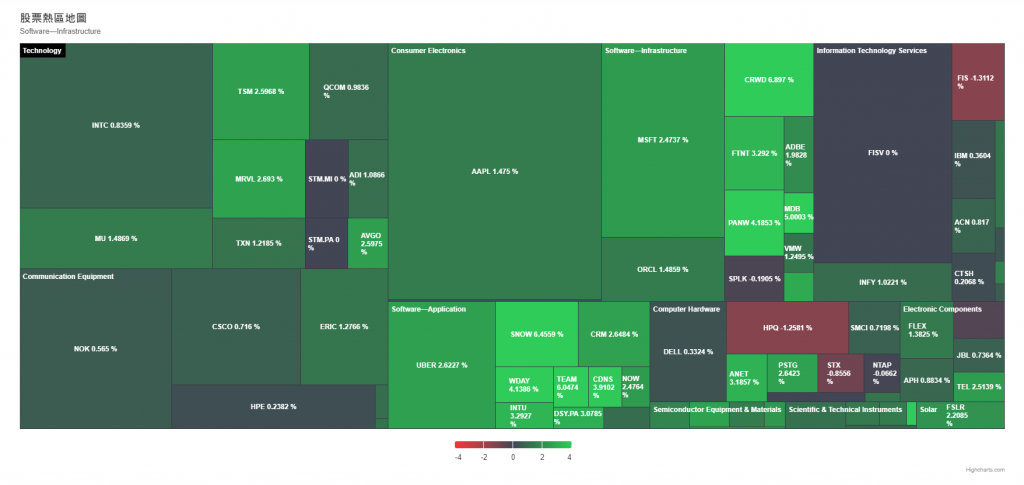
接著是
圖表的datalabels
我希望第一層的datalabels在整張圖表的左上方及黑底白字
所以調整了levels的level:1及datalabels的參數
並且小於一定面積的圖
不顯示datalabels
所以在levels的level:3的datalabels.formatter設定一個function
當圖片小於3000平方px時不顯示
有預期到hotmap應該是最難的部分
但我還是太淺
沒想到資料多一層處理的方式就複雜許多
而且特效跟顯示的欄位越多
需要調整的也呈倍數成長
結果我的天數也成長2倍了...