完成HighChart股票視覺工具GUI功能
// highcharts.client.js

// gui
import stockTools from "highcharts/modules/stock-tools";
import "highcharts/css/stocktools/gui.css";
import annotations from "highcharts/modules/annotations";
import annotationsAdvanced from "highcharts/modules/annotations-advanced";
import dragPanes from "highcharts/modules/drag-panes";
import fullScreen from "highcharts/modules/full-screen";
import priceIndicator from "highcharts/modules/price-indicator";
import exportData from "highcharts/modules/export-data";
import exporting from "highcharts/modules/exporting";

export default defineNuxtPlugin((nuxtApp) => {

// ...略

  stockTools(Highcharts)
  annotations(Highcharts)
  annotationsAdvanced(Highcharts)
  dragPanes(Highcharts)
  fullScreen(Highcharts)
  priceIndicator(Highcharts)
  exportData(Highcharts)
  exporting(Highcharts)

  /* add icons to the library */
  library.add(faUserSecret,faCirclePlus,faCircleMinus)

  nuxtApp.vueApp
    .use(HighchartsVue)
    .use(VueAxios, axios)
    .provide('axios', axios)  // provide 'axios'
    .use(SimpleTypeahead)
    .component('font-awesome-icon', FontAwesomeIcon)
})
昨天已經建立好GUI的按鈕
並把功能給打開了
今天要做的是就是把以上的模組給安裝上去即可
就會有正常的功能
(本來以為還要個別寫事件,但如果沒有要客製化按鈕跟功能其實不用)
簡單介紹一下每個功能的作用(依照按鈕由上至下順序):
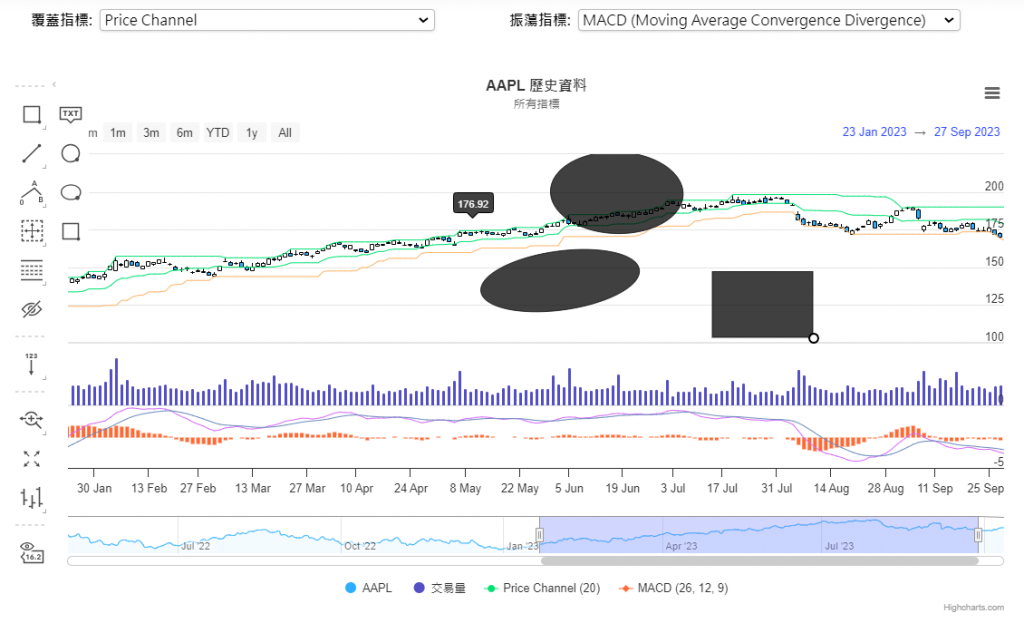
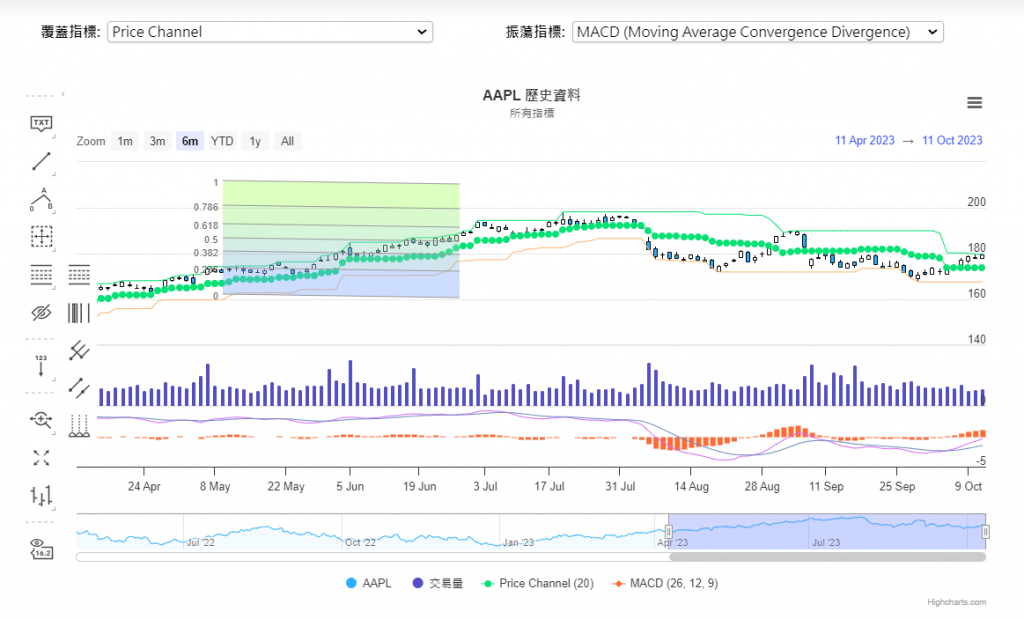
這個主要是用來產生簡單的幾何形狀
方便做遮蔽或者構圖用的
其中此功能裡面第一個選項為標示出滑鼠指的y軸高度
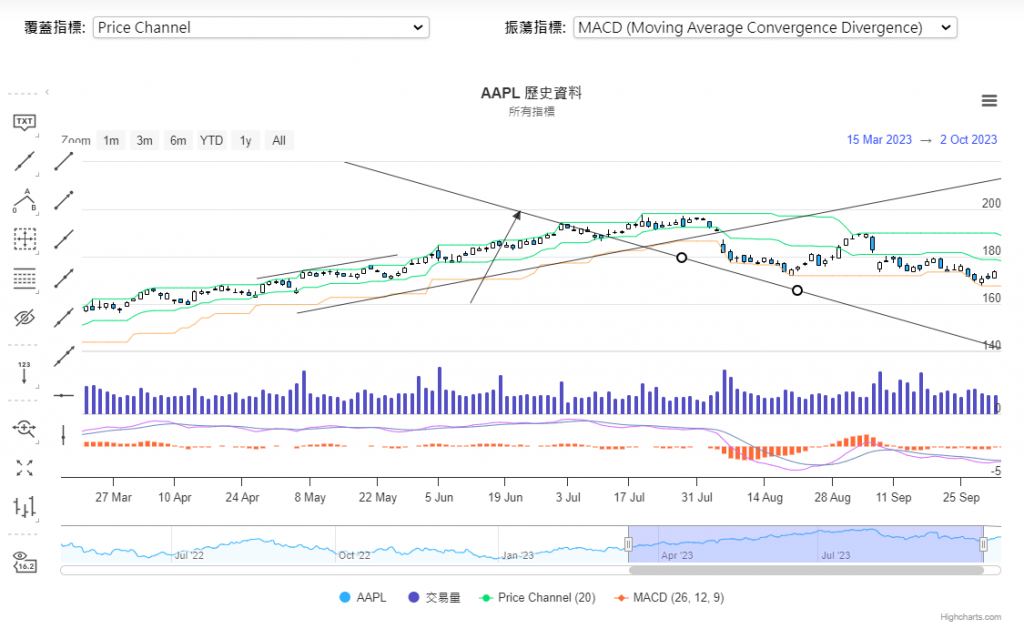
顧名思義就是各種(直)線工具
方便比較各股價某波段的斜率
或用箭頭去做更明確的標示
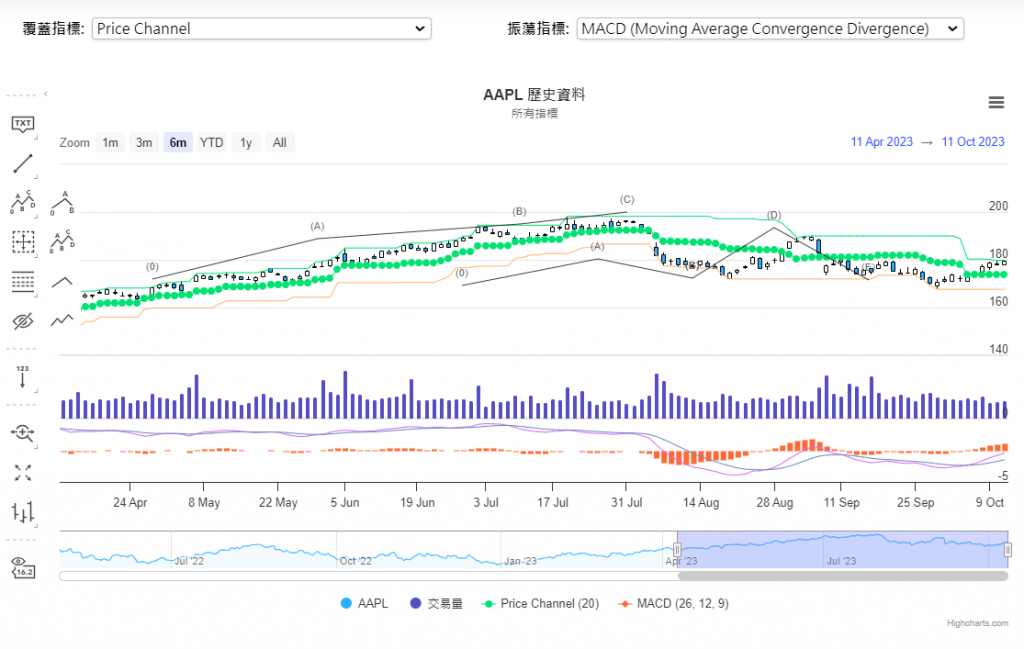
繪製有彎曲或折線的線段
方便去比較高低點
或者是有無重複的波段
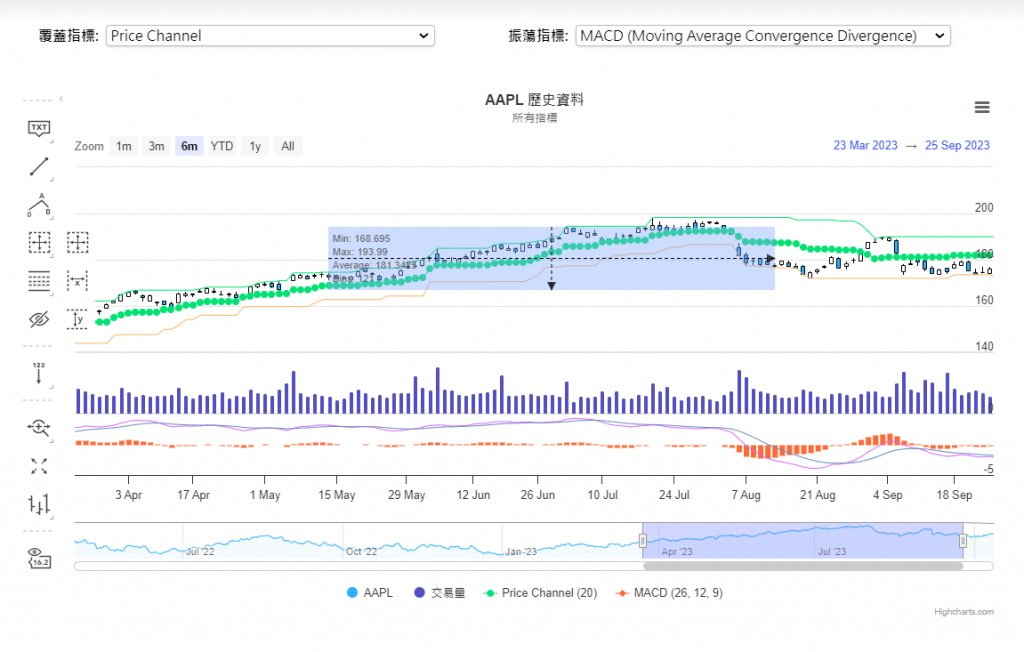
測量價格和時間變化的工具
進階的繪圖工具
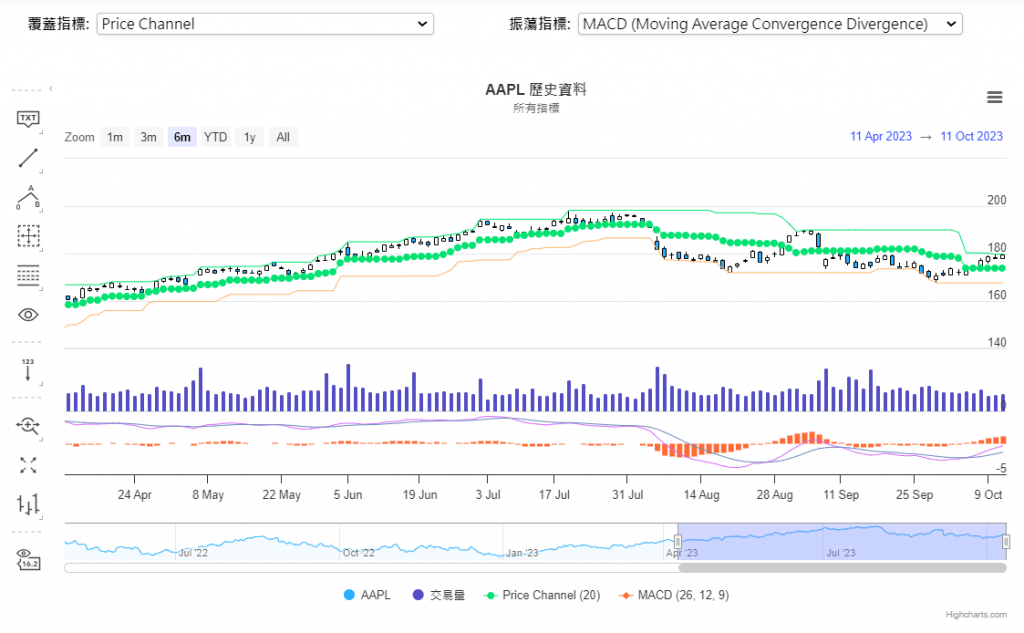
開啟或關閉繪圖工具的所畫或所寫的註解
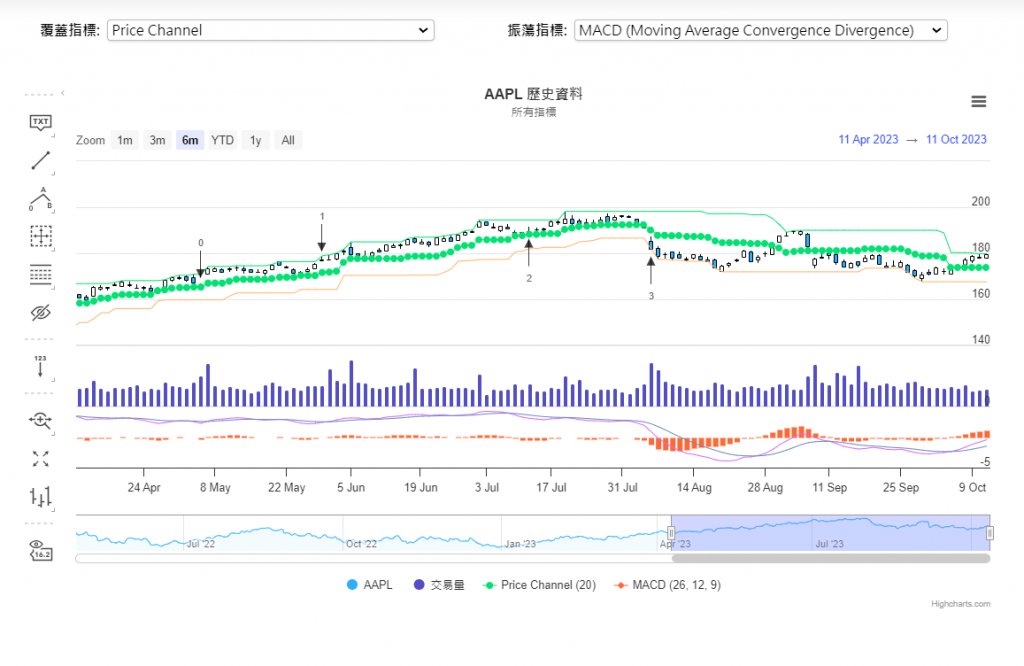
添加垂直的文字標籤
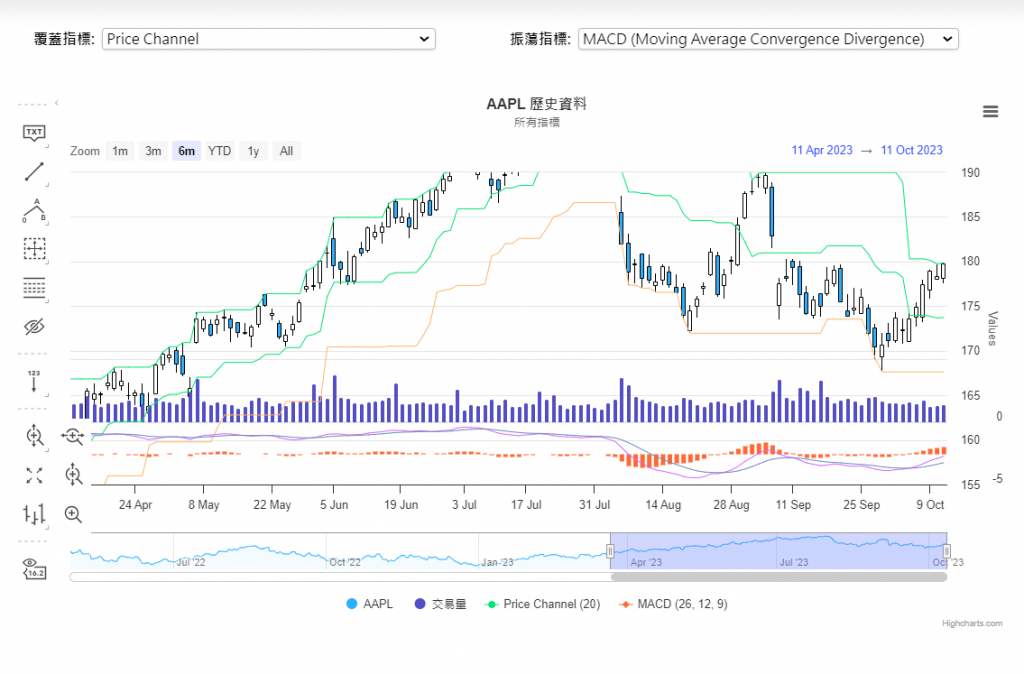
改變縮放的方式(橫向縮放,垂直縮放,橫向跟垂直同時縮放)
全螢幕功能
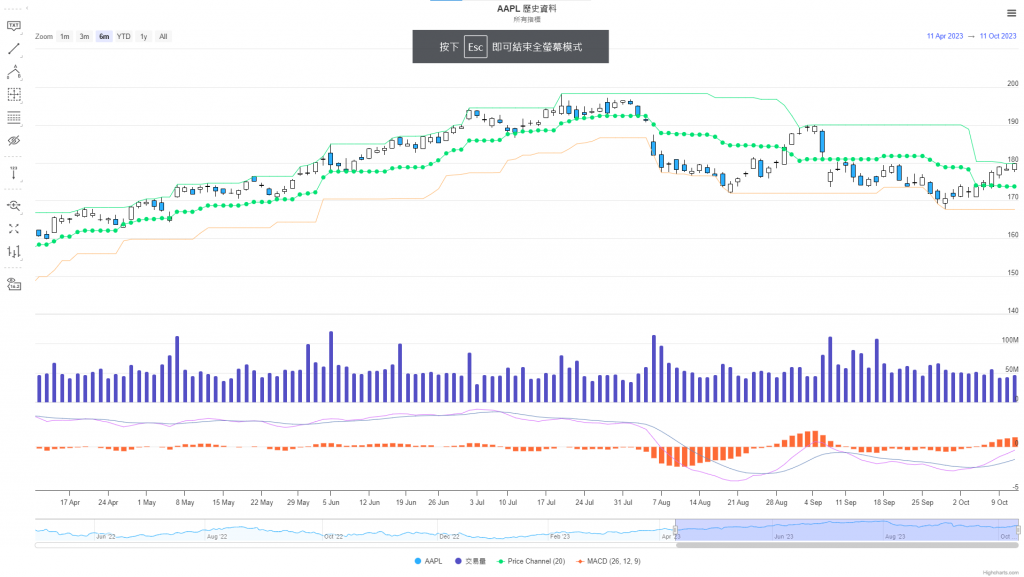
切換圖表類型,像是從線圖切換到蠟燭圖
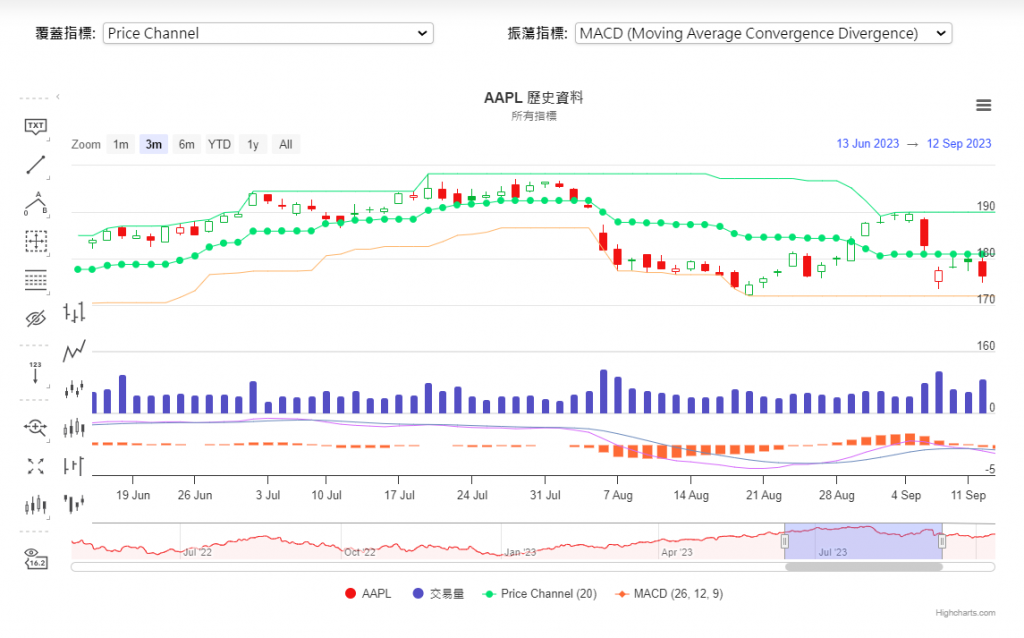
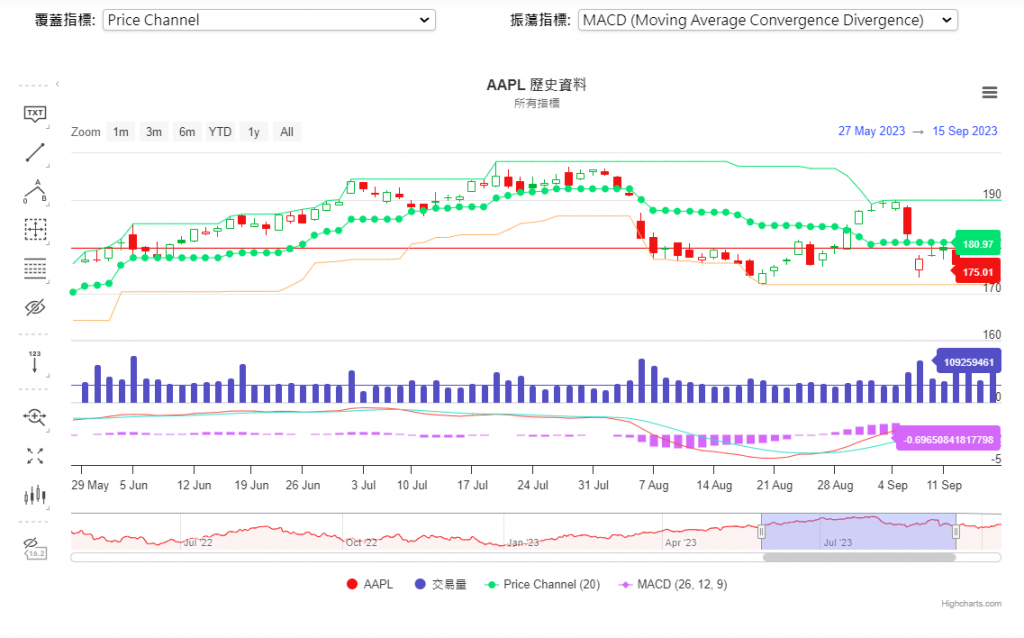
當前價格的指示器
不管是看1個月或1年
最右邊都會顯示最新的價格或技術指標數字
其實蠻想玩玩客製化的
但礙於時間
還是想先把該做的功能試著先完成
忍痛跳過囉!!
