完成股票篩選器剩餘功能
初步建立HighChart股票視覺工具GUI
// stockFilter.vue
<div class="my-1 w-[50%]">
<label for="marketCap" class="font-bold">市值超過:</label>
<select
class="border border-solid border-[#bebebe] rounded shadow ms-2 w-[70%]"
id="marketCap"
v-model="marketCap"
@change="getData"
>
<option value="" key="none" label="請選擇" />
<option
v-for="(v,i) in marketCapOption"
:value="v.value"
:key="i"
:label="v.label"
/>
</select>
</div>
// ...下面重複5個 略
<script setup>
const marketCap = ref('10000000000')
const volume = ref('50000')
const sector = ref('Technology')
const industry = ref('Software—Infrastructure')
const dividend = ref('0')
const beta = ref('1.5')
const marketCapOption = ref([
{label:'超過5000萬美元',value:'50000000'},
{label:'超過3億美元',value:'300000000'},
{label:'超過20億美元',value:'2000000000'},
{label:'超過100億美元',value:'10000000000'},
])
const volumeOption = ref([
{label:'超過5萬',value:'50000'},
{label:'超過10萬',value:'100000'},
{label:'超過20萬',value:'200000'},
{label:'超過30萬',value:'300000'},
{label:'超過40萬',value:'400000'},
{label:'超過50萬',value:'500000'},
{label:'超過75萬',value:'750000'},
{label:'超過100萬',value:'1000000'},
])
const sectorOption = ref([])
const industryOption = ref([])
const dividendOption = ref([
{label:'超過0美元',value:'0'},
{label:'超過10美元',value:'10'},
{label:'超過50美元',value:'50'},
])
const betaOption = ref([
{label:'低於0.5',value:'0.75'},
{label:'低於1',value:'1'},
{label:'低於1.25',value:'1.25'},
{label:'低於1.5',value:'1.5'},
{label:'低於2',value:'2'},
])
const stockApi =computed(()=>`https://financialmodelingprep.com/api/v3/stock-screener?marketCapMoreThan=${marketCap.value}&volumeMoreThan=${volume.value}§or=${sector.value}&industry=${industry.value}÷ndMoreThan=${dividend.value}&betaLowerThan=${beta.value}&limit=500&apikey=${fmp}`)
const sectorApi = `https://financialmodelingprep.com/api/v3/sector-performance?apikey=${fmp}`
const industryApi = `https://financialmodelingprep.com/api/v4/industry_price_earning_ratio?date=2023-10-10&exchange=NASDAQ&apikey=${fmp}`
</script>
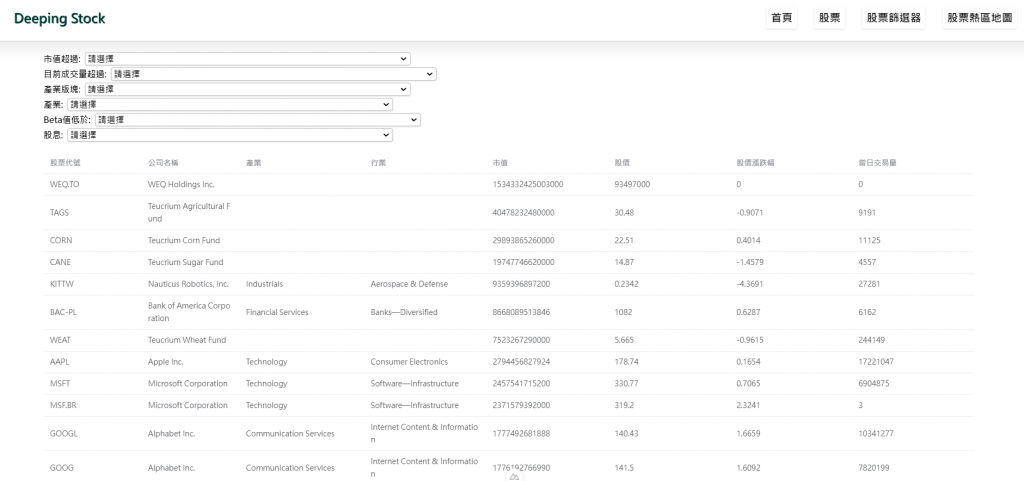
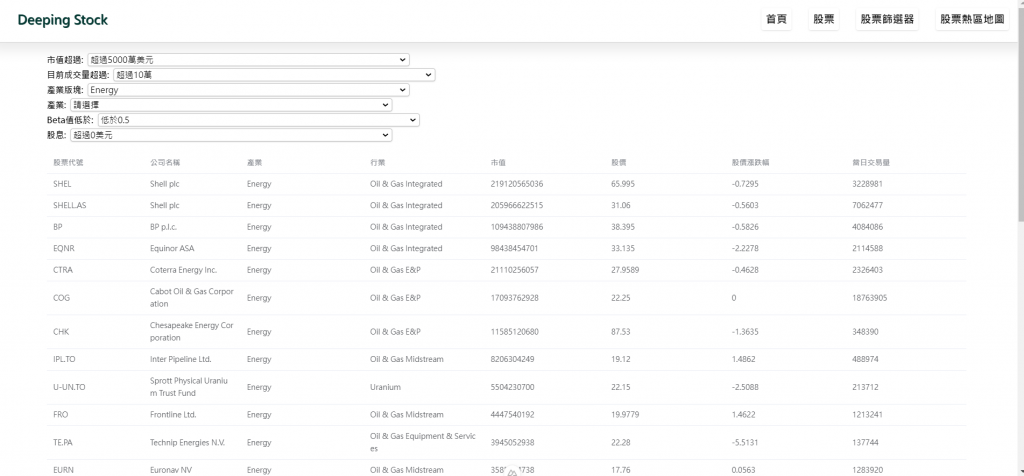
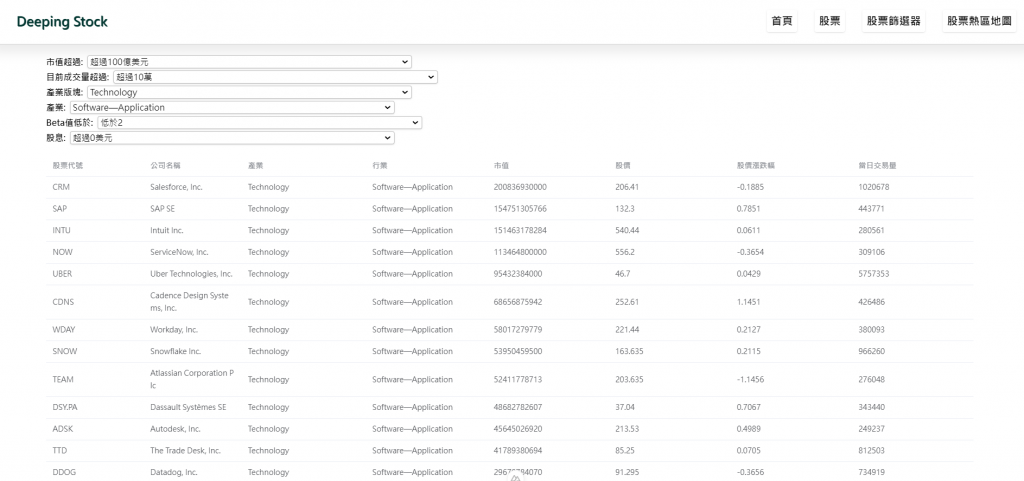
這邊主要是把select裡的option用迴圈帶出來
其中sector跟indusrty的option比較多
就直接透過sectorApi跟industryApi抓資料回來在帶回去array裡面,再去跑迴圈
最後在select上面用@change="getData"
選完即更新最新資料
沒有任何條件
不同條件

// highcharts.client.js

import stockTools from "highcharts/modules/stock-tools";
import "highcharts/css/stocktools/gui.css";

export default defineNuxtPlugin((nuxtApp) => {

  // ...略
  stockTools(Highcharts)

})

// [id].vue 股票單頁
  <ClientOnly>
    <highcharts
      class="w-[95%] mx-auto my-10"
      :constructor-type="'stockChart'"
      :options="chartOptions"
      :callback="afterChartInit"
    />
  </ClientOnly>

<script setup>
const chartOptions = computed(() => {
  return {
// ...略
    stockTools: {
        gui: {
            enabled: true,  // 啟用 GUI
            buttons:[ 'indicators', 'separator', 'simpleShapes', 'lines', 'crookedLines', 'measure', 'advanced', 'toggleAnnotations', 'separator', 'verticalLabels', 'flags', 'separator', 'zoomChange', 'fullScreen', 'typeChange', 'separator', 'currentPriceIndicator', 'saveChart']  // 預設的按鈕列表
        }
    },
  }
})

</script>
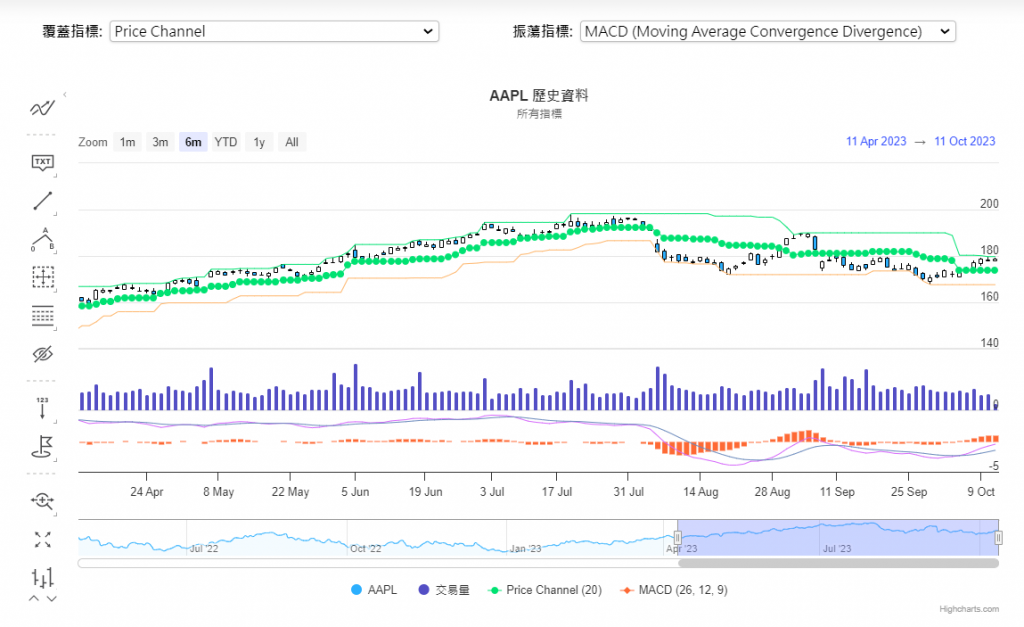
回到DAY15和DAY17的股票資訊單頁
目標是在圖表上面增加視覺化工具
先在highcharts.client.js安裝stocktools的模組及引入專屬CSS
之後再到chartOptions裡的stockTools啟用跟預設想要的按鈕

官方說明沒說要加入CSS
害我找了老半天...想說還有什麼隱藏功能要開嗎??
好在之前被耍過幾次了
翻範例找最準!!
明天把按鈕跟事件做結合
敬請期待
再四天完賽!!
