iT邦幫忙

2023 iThome 鐵人賽

DAY 24
0
Security

Zabbix 監控實做分享系列 第 24

24-安裝Grafana

  • 分享至 

  • xImage
  •  

前言

Grafana為開源視覺化監控工具,Zabbix&Grafana兩者的結合提供了一個強大靈活的解決方案,可以使用Grafana來視覺化呈現Zabbix的圖形,讓Zabbix的數據圖形更加豐富。

ㄧ、安裝Grafana

1.安裝 Grafana
官網連結Download Grafana

#sudo yum install -y https://dl.grafana.com/oss/release/grafana-8.5.0-1.x86_64.rpm
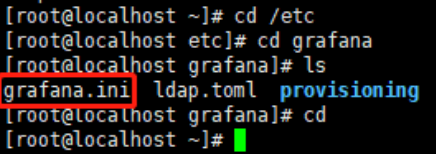
2.查看檔案是否成功安裝

#cd /etc
#cd grafana
#ls
#cd

https://ithelp.ithome.com.tw/upload/images/20231009/20161484kpvC2JGeHJ.png
3.啟動服務並設定開機自起

#systemctl start grafana-server
#systemctl enable grafana-server

4.檢查服務是否成功啟動

#netstat -lntup

Grafana 使用'3000'Port,確認'3000'Port是否啟用
https://ithelp.ithome.com.tw/upload/images/20231009/20161484bgPAW6hl9D.png

二、啟用Grafana-Zabbix

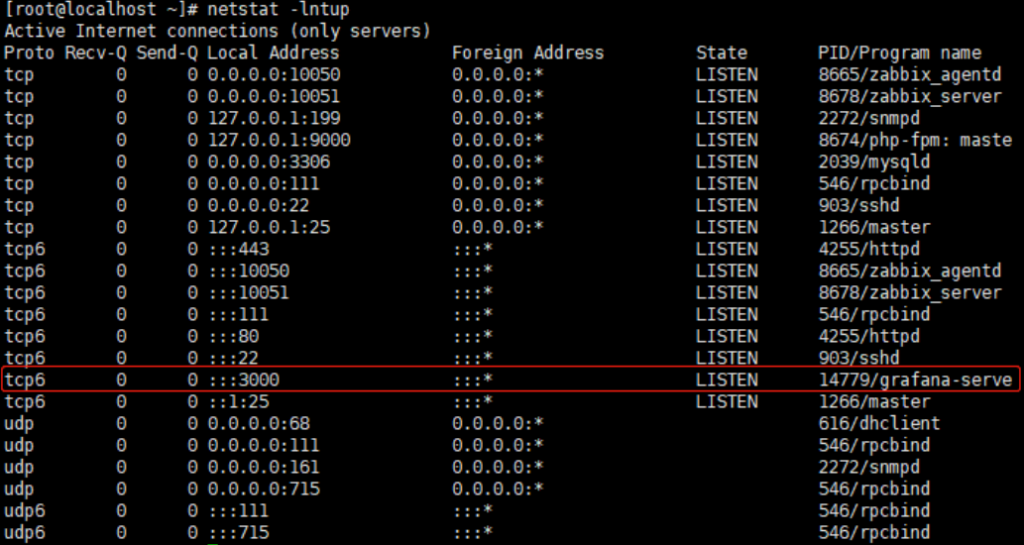
1.以上安裝配置完成後,打開瀏覽器,進入Grafana,輸入 『IP:3000』。
https://ithelp.ithome.com.tw/upload/images/20231009/20161484zbgksG3wjr.png
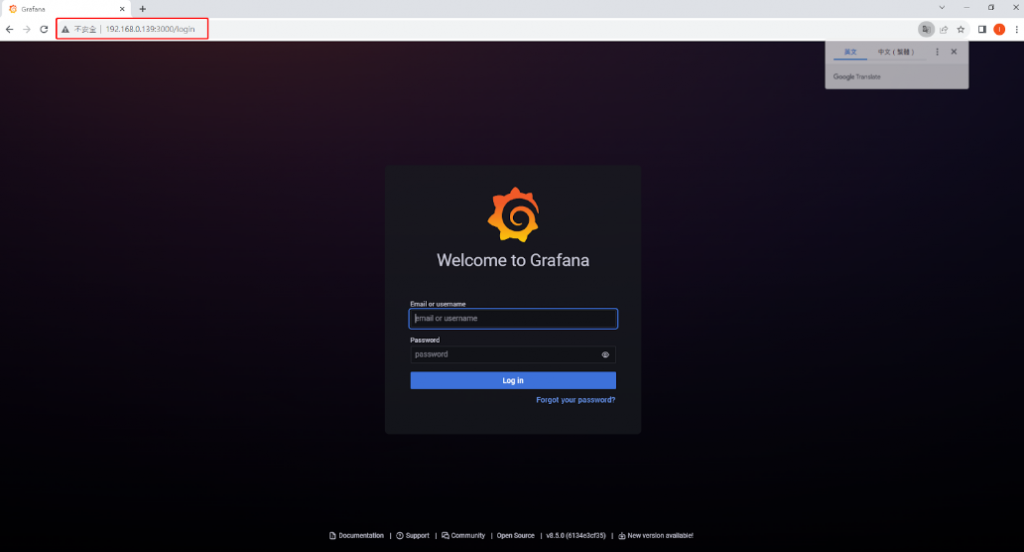
2.默認帳號密碼為admin/admin。
https://ithelp.ithome.com.tw/upload/images/20231009/20161484TA1RTA5Q9p.png
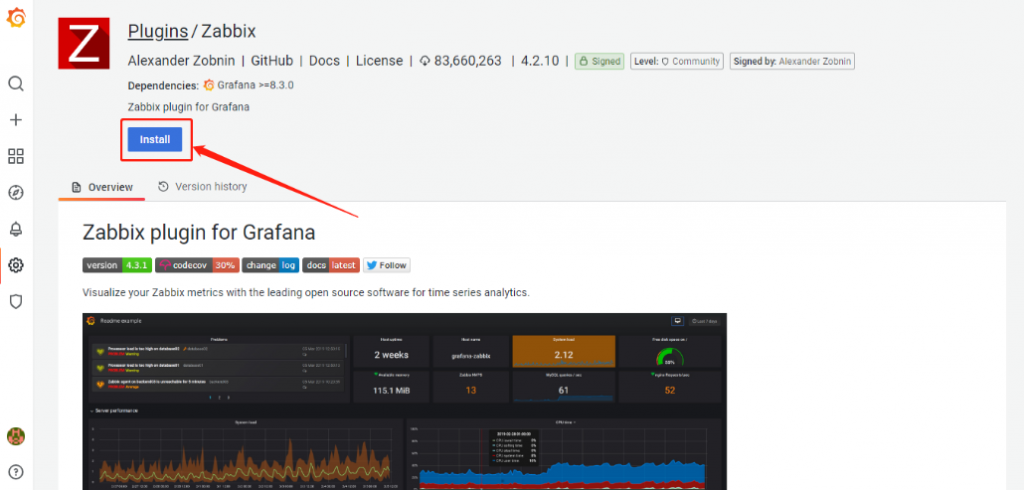
3.進入後點選 Configuration << Plugins << 搜尋Zabbix ,點擊安裝
https://ithelp.ithome.com.tw/upload/images/20231009/20161484FEUS7ZJWJs.png
https://ithelp.ithome.com.tw/upload/images/20231009/201614844p5DgmVDrN.png
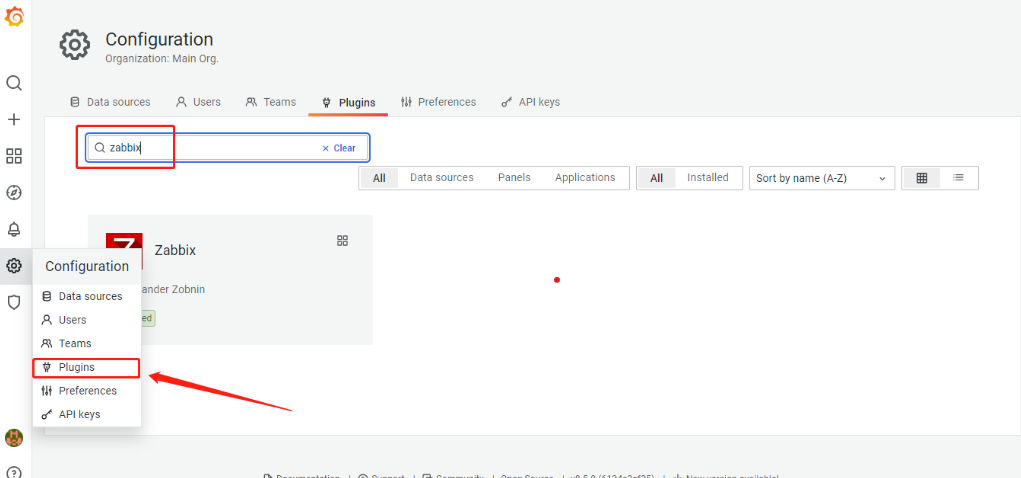
4.安裝完成後進入 Configuration >> Data Sources >> 搜尋Zabbix 配置數據元。
https://ithelp.ithome.com.tw/upload/images/20231009/20161484UaNIlbDtZa.png
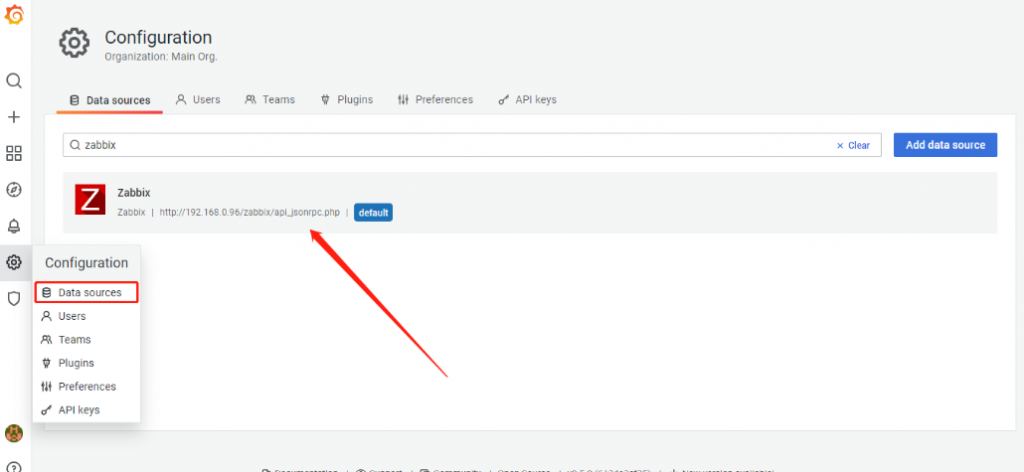
5.填寫URL http:// zabbixserver-ip /zabbix/api_jsonrpc.php
https://ithelp.ithome.com.tw/upload/images/20231009/20161484FuuyOg1XJ9.png
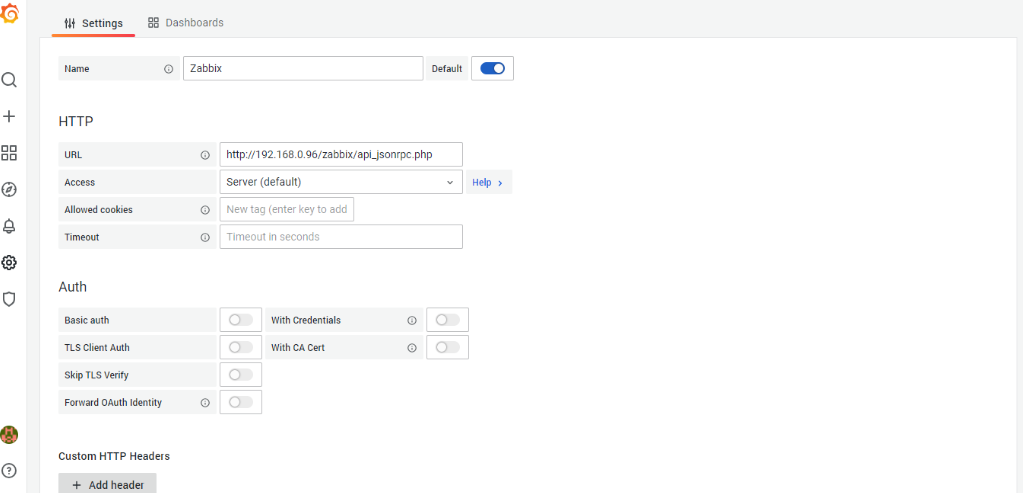
填寫Zabbix API 信息,輸入Zabbix Server 帳號密碼,填寫完成後儲存資料。
https://ithelp.ithome.com.tw/upload/images/20231009/20161484iqMM41hQRE.png
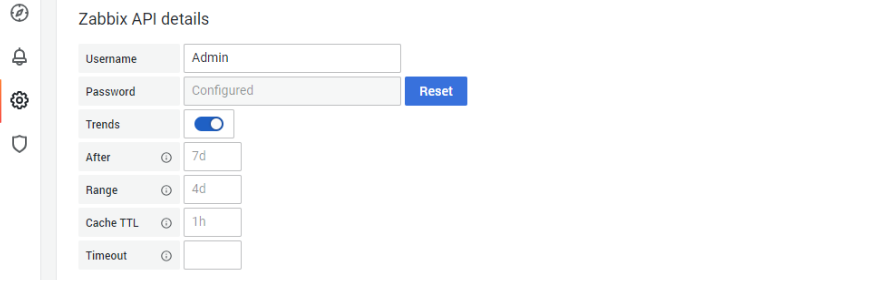
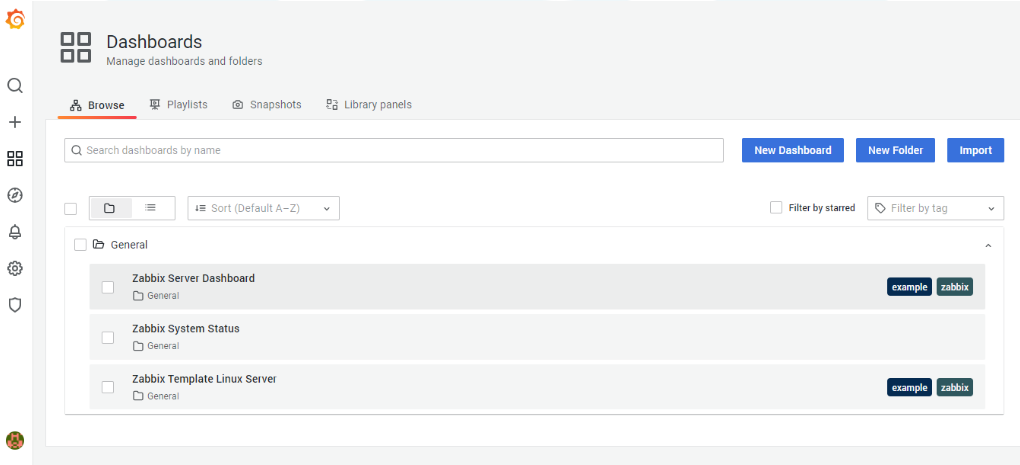
6.接下來點擊上方Dashboards,可以匯入內建範例儀表板。
https://ithelp.ithome.com.tw/upload/images/20231009/20161484VkvL6kHzMS.png
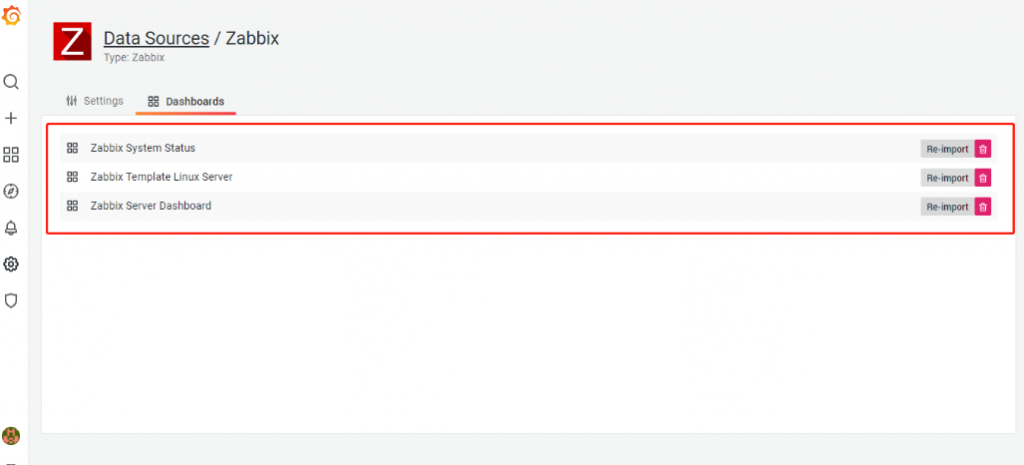
7.成功匯入後進入 Dashborads >> Browse 即可編輯新增儀表板。
https://ithelp.ithome.com.tw/upload/images/20231009/20161484Q9rn2g1q7O.png


上一篇
23-Zabbix Proxy 啟動服務
下一篇
25-Grafana 新增圖表
系列文
Zabbix 監控實做分享28
圖片
  直播研討會
圖片
{{ item.channelVendor }} {{ item.webinarstarted }} |
{{ formatDate(item.duration) }}
直播中

尚未有邦友留言

立即登入留言