Day 10: ELK Stack 安裝與多節點
Day 11: Logstash 配置與查詢系統日誌
Day 12: Redis 安裝與後台
Day 13: Redis Cluster 集群配置
Day 14: Prometheus 與 Grafana 安裝與監控
Day 15: 配置 Prometheus 監控 Kubernetes 叢集
Day 16: 使用 Grafana 進行數據視覺化及串接告警
Prometheus 是一個開源的監控系統和時間序列資料庫,專為監控和告警設計。它收集應用程式和基礎設施的各類指標數據,並通過其強大的查詢語言 PromQL 進行分析和視覺化展示。Prometheus 常用於監控微服務架構和雲原生環境。
# Copyright VMware, Inc.
# SPDX-License-Identifier: APACHE-2.0

version: '2'

services:
  prometheus:
    #映像檔來源為bitnami
    image: docker.io/bitnami/prometheus:2
    #若服務掛了會自動重啟
    restart: always
    command:
      #配置文件路徑
      - --config.file=/etc/prometheus/prometheus.yml
      #允許跨集群寫入
      - --web.enable-remote-write-receiver
      #允許通過api熱加載配置
      - --web.enable-lifecycle
    volumes:
      - ./data/prometheus:/prometheus
      - ./prometheus.yml:/etc/prometheus/prometheus.yml
    ports:
      - "9090:9090"
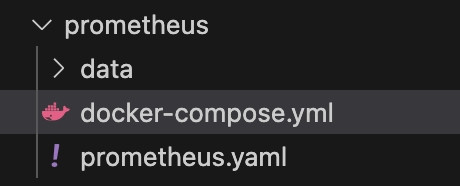
預先新增一個prometheus.yml
global:
  #抓取間隔
  scrape_interval: 15s

scrape_configs:
  - job_name: 'prometheus'
    static_configs:
      #目標主機地址及端口
      - targets: ['<本機地址>:9090']
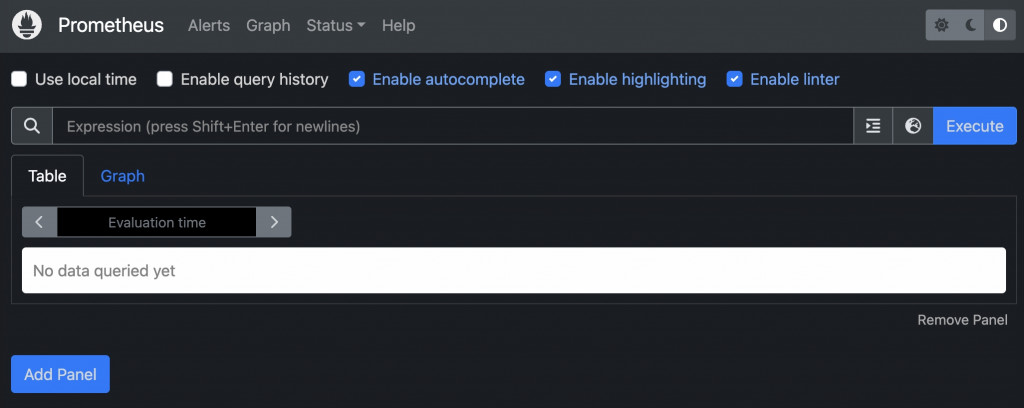
瀏覽器訪問端口:9090試試
若要驗證是否有連線上目標主機
可以通過「Status > Targets」查看
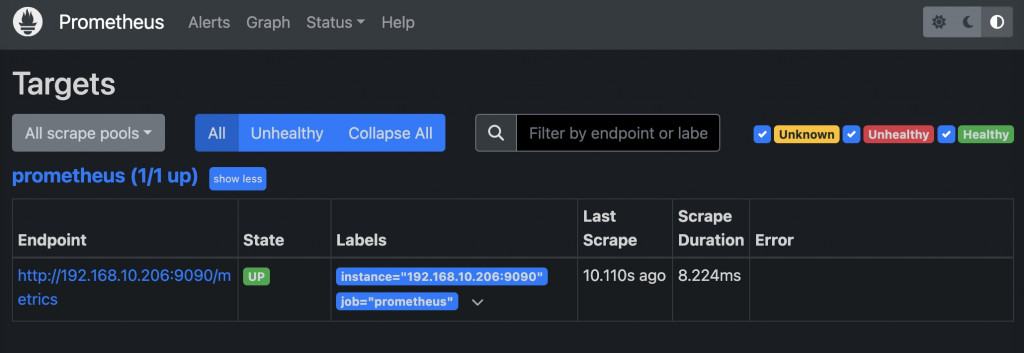
這時候還沒有數據,讓我們新增一台本機資訊的數據進來
Node Exporter 是 Prometheus 的一個專用工具,用於收集 Linux 系統的各種硬體和作業系統層級的指標數據,如 CPU 使用率、記憶體、磁碟 I/O、網路流量等。它能幫助監控伺服器的運行狀況,適用於系統性能監控。
version: '2'

services:
    node-exporter:
        image: docker.io/bitnami/node-exporter:1
        container_name: node-exporter
        restart: always
        ports:
            - "9100:9100"
安裝好之後回到剛才的「prometheus.yml」裡面新增目標主機
global:
  #抓取間隔
  scrape_interval: 15s

scrape_configs:
  - job_name: 'prometheus'
    static_configs:
      #目標主機地址及端口
      - targets: ['<本機地址>:9090']

  - job_name: 'node-exporter'
    static_configs:
      #目標主機地址及端口
      - targets: ['<本機地址>:9100']
        labels:
          environment: "測試機"
在Terminal終端機直接打api進行熱加載配置(不需重啟)
curl -X POST http://localhost:9090/-/reload
此時回到prometheus的頁面查看,目標主機已經出現node-exporter
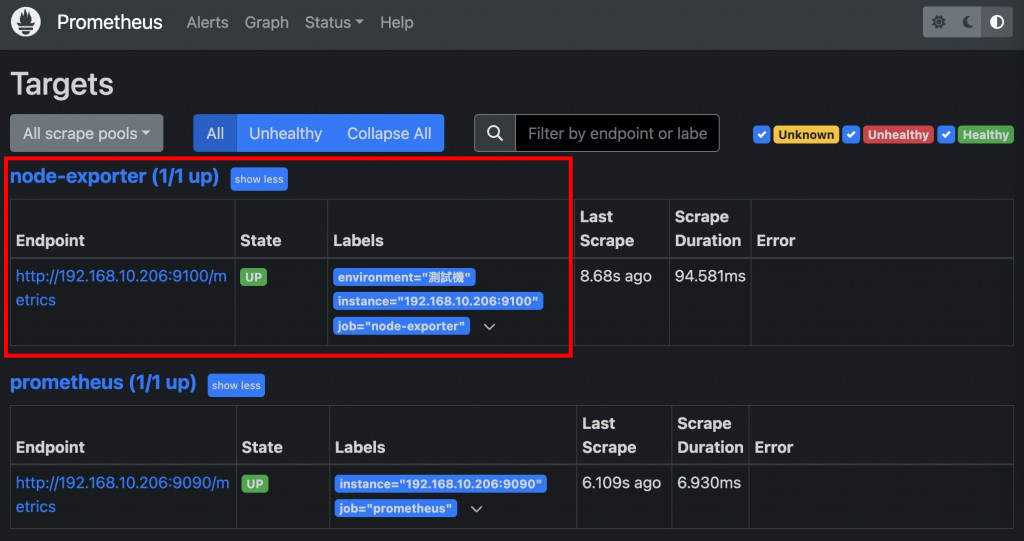
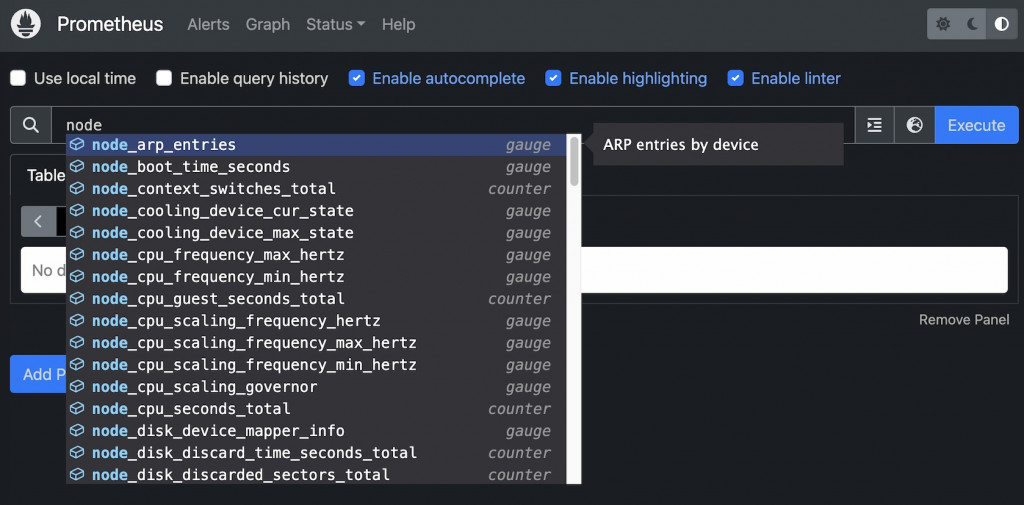
並且也能搜尋到一些node開頭的相關指標(metrics)
這個時候就輪到我們的Grafana出場了!
Grafana 是一個開源的數據可視化和監控平台,用於將不同數據源(如 Prometheus、Elasticsearch、Graphite 等)的數據以圖表和儀表板的形式展示。Grafana 支持豐富的插件系統,可以靈活地自定義儀表板和告警規則,讓使用者輕鬆追蹤系統性能和業務指標。它廣泛應用於 DevOps 團隊中,用於實現實時監控和數據分析。
version: '2'

services:
  grafana:
    image: docker.io/bitnami/grafana:9
    restart: always
    ports:
      - '3000:3000'
    environment:
      #配置管理員密碼
      - 'GF_SECURITY_ADMIN_PASSWORD=test'
      # - 'GF_SERVER_ROOT_URL=<你的完整域名>'
    volumes:
      - ./volumes:/opt/bitnami/grafana/data
volumes:
  grafana_data:
    driver: local
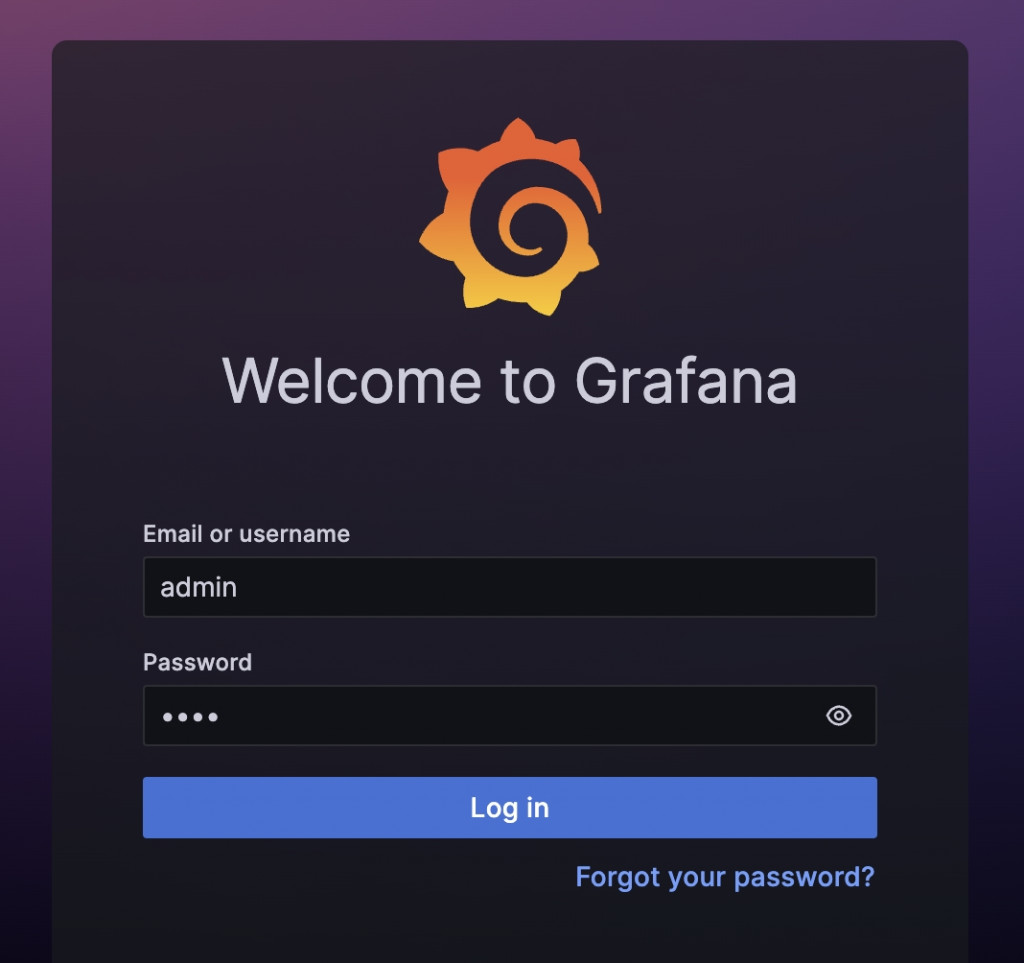
運行之後打開瀏覽器訪問端口:3000
帳號admin 密碼是上面腳本配置的test
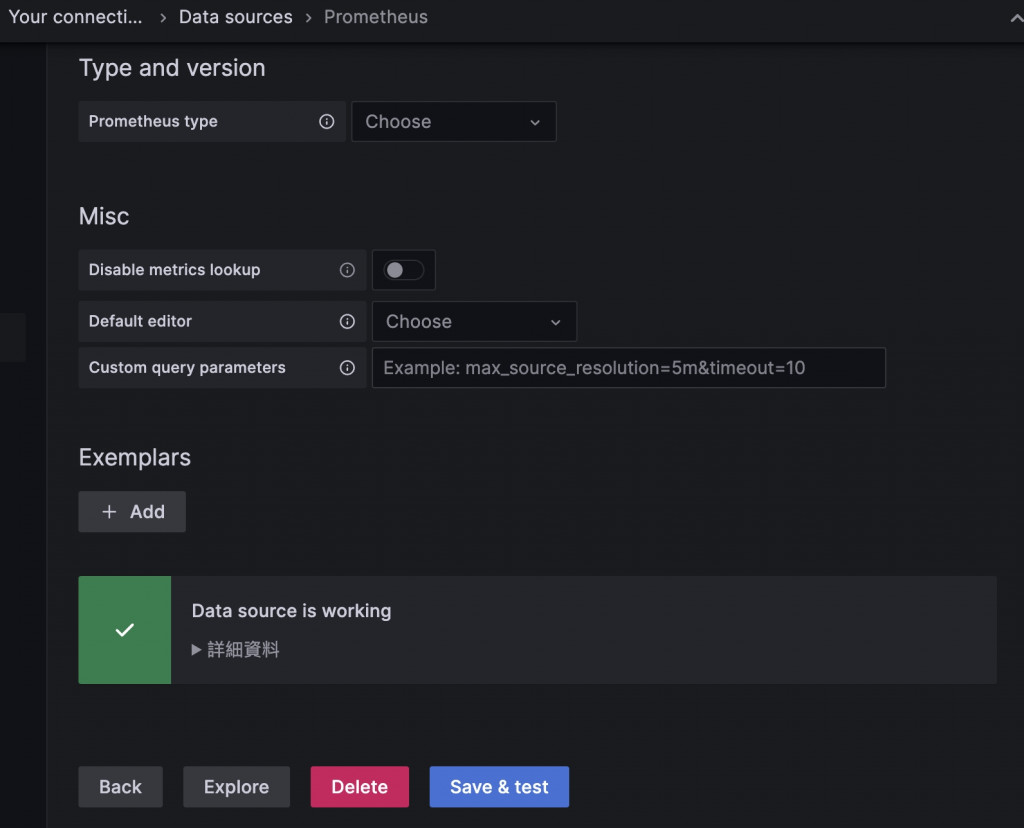
登入之後需要做兩件事情
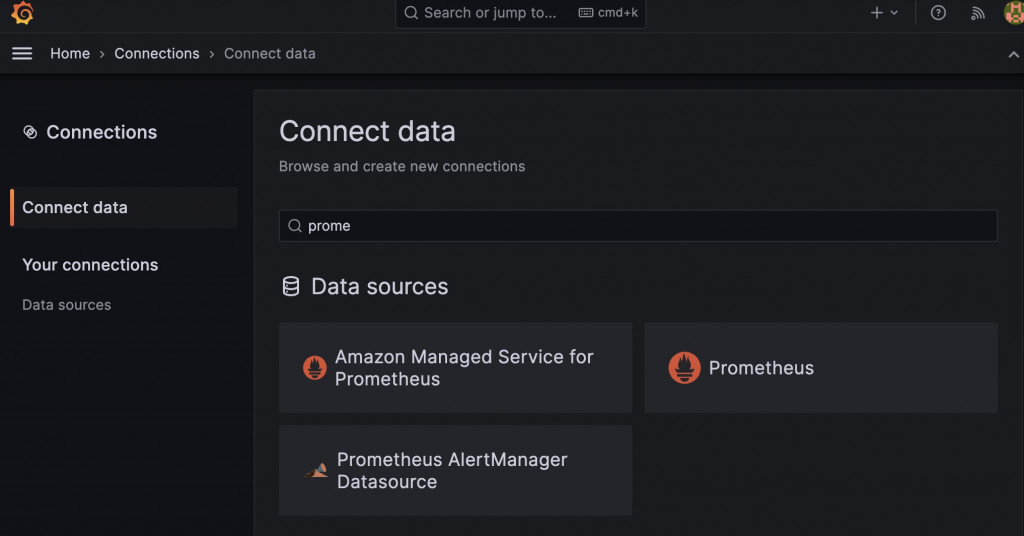
填入 http://主機地址:9090 其他預設即可
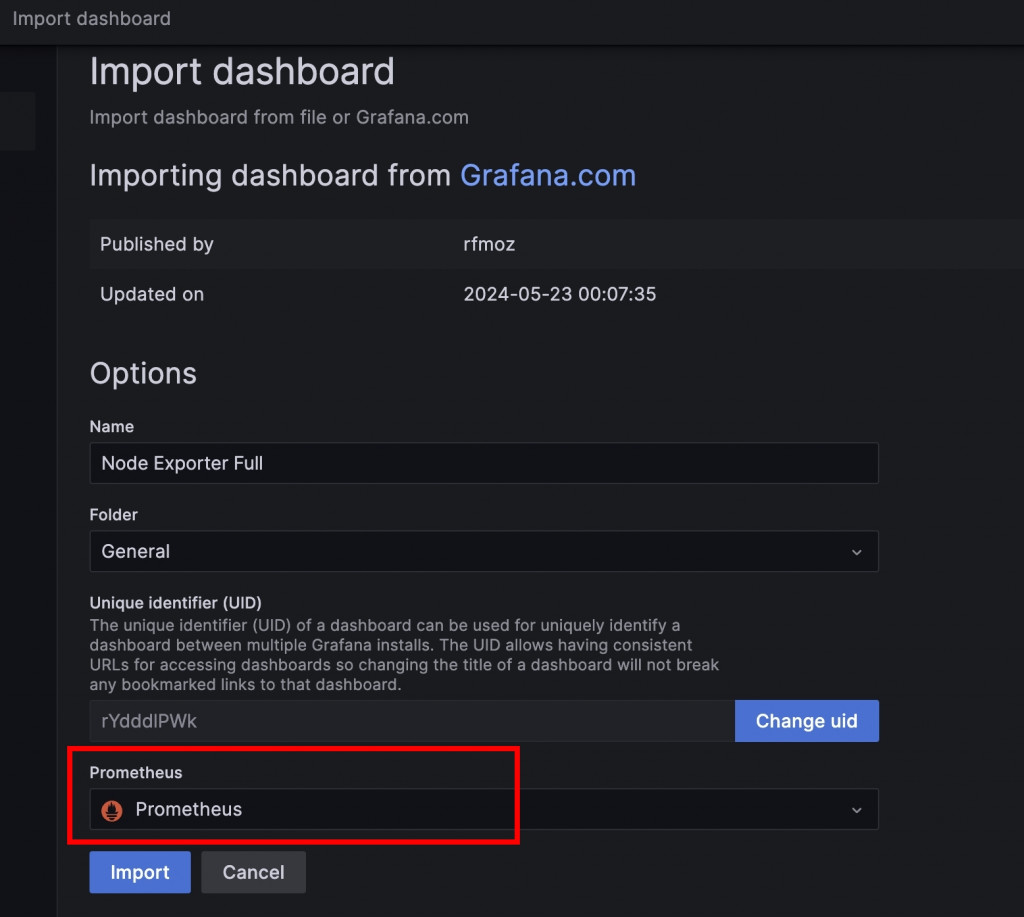
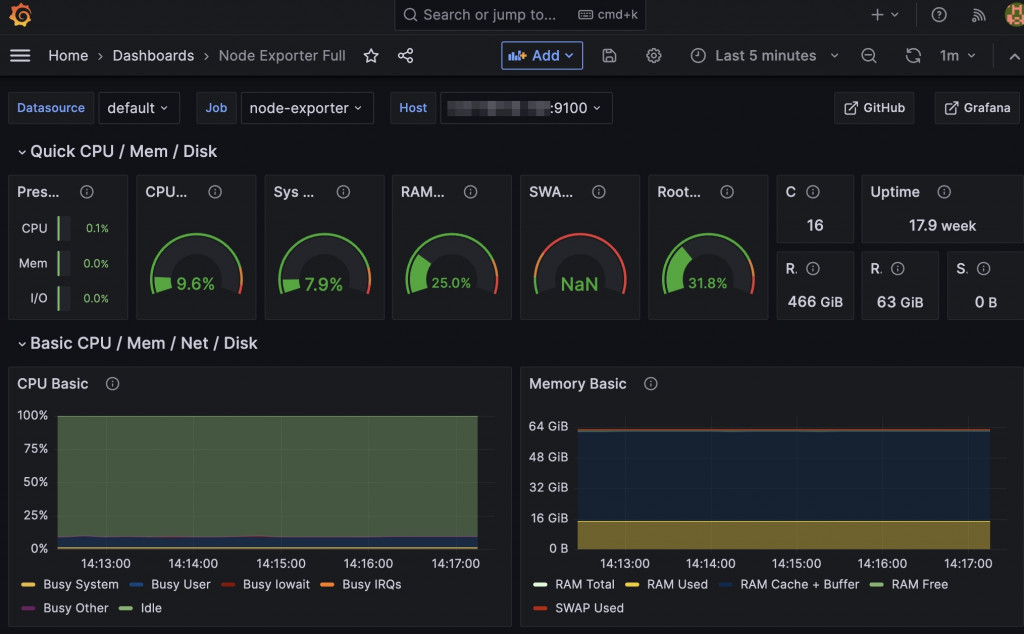
再來從主選單回到Dashboard,查看剛才建立的面板,就能看見系統資訊囉!