Day 10: ELK Stack 安裝與多節點
Day 11: Logstash 配置與查詢系統日誌
Day 12: Redis 安裝與後台
Day 13: Redis Cluster 集群配置
Day 14: Prometheus 與 Grafana 安裝與監控
Day 15: 配置 Prometheus 監控 Kubernetes 叢集
Day 16: 使用 Grafana 進行數據視覺化及串接告警
因為前兩天已經偷跑Grafana數據呈現了
今天只好講解一下其他好用的功能(?)
Grafana 的 Metrics 查詢功能允許用戶從多種數據源(如 Prometheus、Graphite)中檢索和可視化性能指標。用戶可以使用查詢語言(如 PromQL)來定義和過濾數據,生成圖表、儀表板和報告。這些查詢支持實時數據分析,並可以設置告警,以便及時響應系統狀態的變化。Grafana 的查詢功能提供靈活且強大的數據可視化,幫助用戶深入了解系統性能和運營狀況。
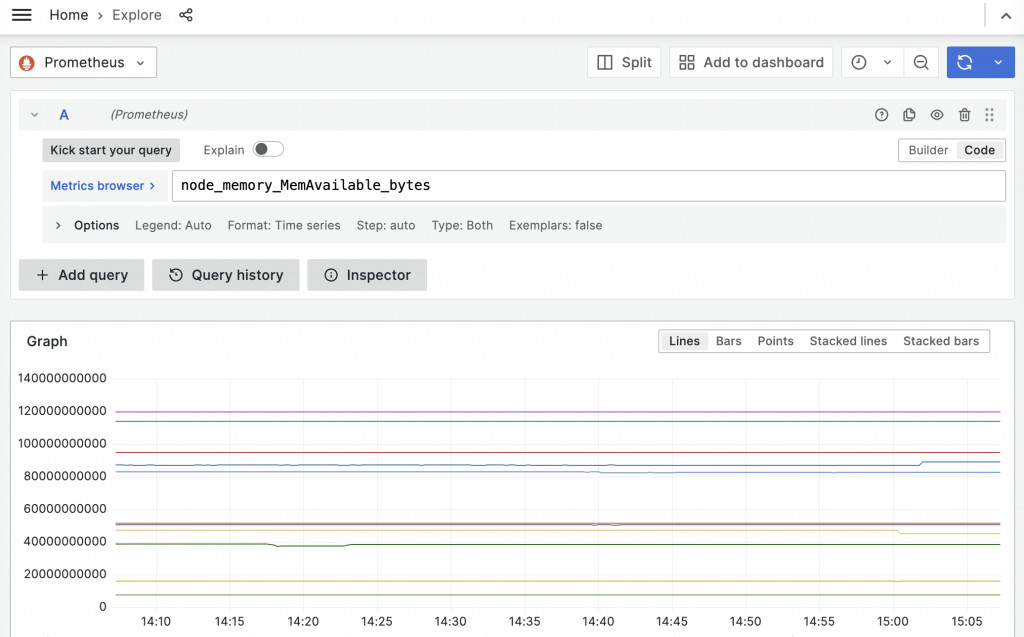
從Home > Explore > 選中數據源 > 開始查詢
例如:想知道記憶體的可用空間
查詢語句:
node_memory_MemAvailable_bytes
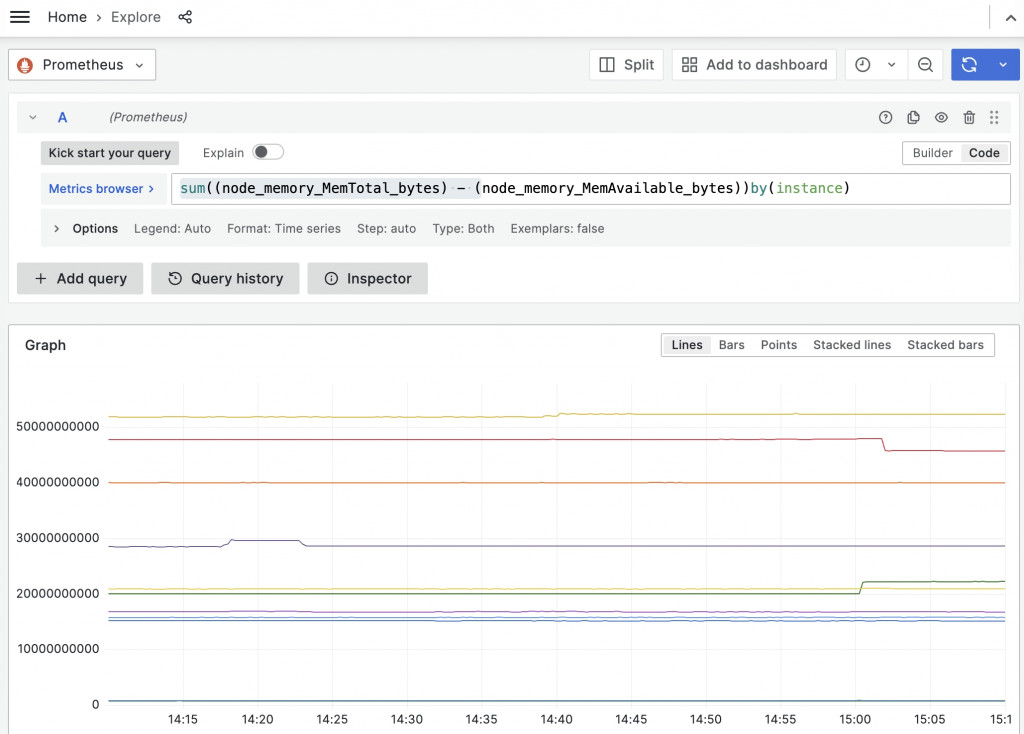
例如:想知道記憶體的佔用空間(總量減去可用空間)
sum((node_memory_MemTotal_bytes) - (node_memory_MemAvailable_bytes))by(instance)
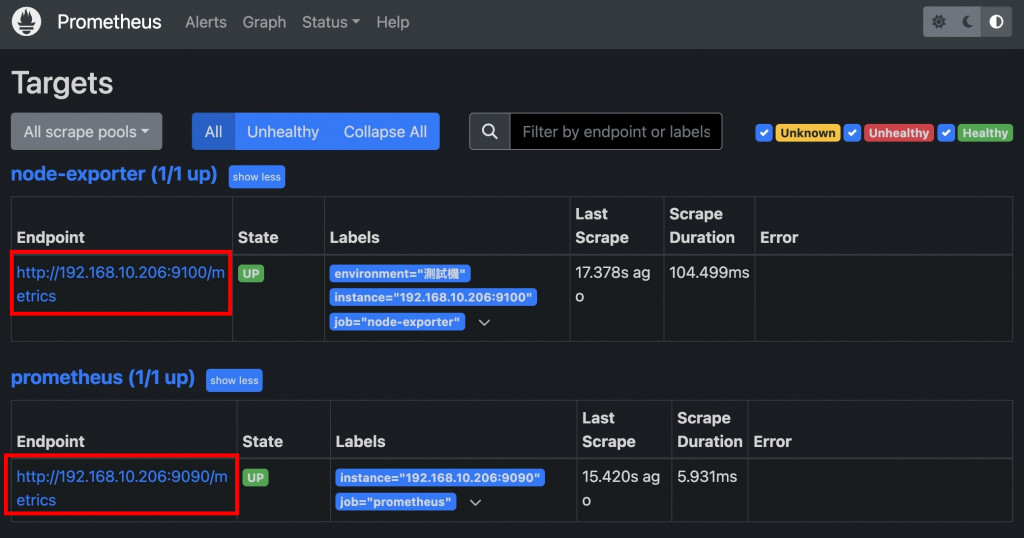
還記得前兩天用到的Prometheus嗎?
在Targets頁面可以進入/metrics頁面查看(直接網址後面打也行)
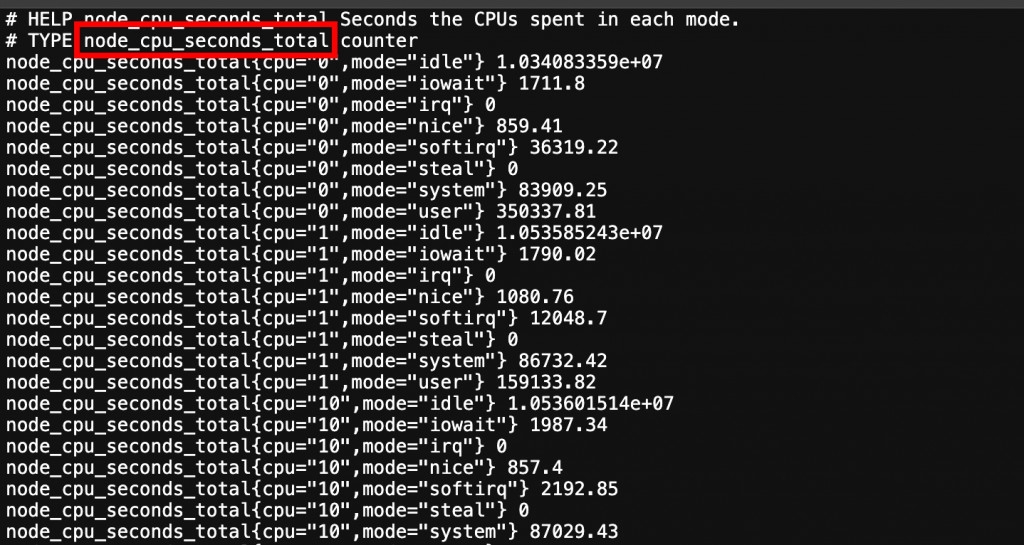
其他的就仰賴各位慢慢探索及客製化了
(LINE Notify側的操作)

(Grfana Alert側的操作)
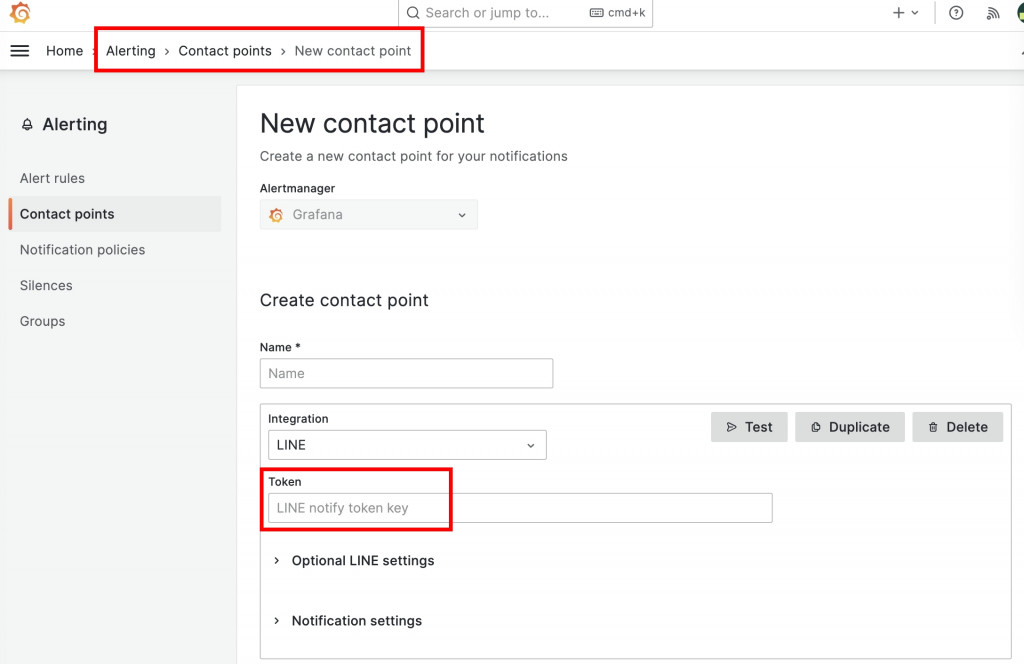
title輸入
{{ len .Alerts.Firing}} firing. {{len .Alerts.Resolved}} resolved.
description輸入
{{ template "line-template-test" . }}
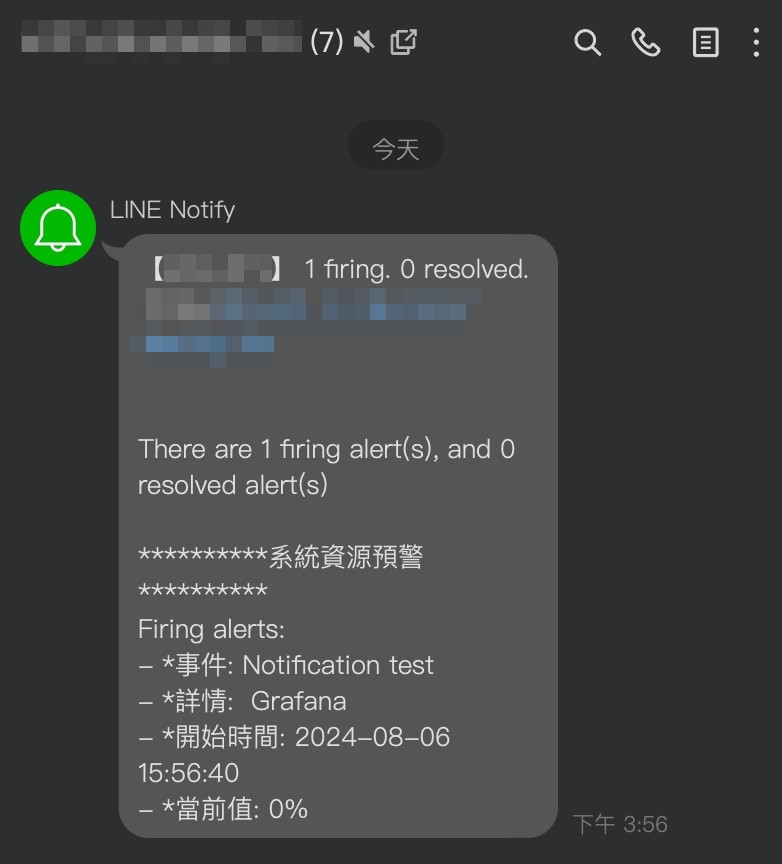
發送一則測試訊息試試,應該會長這樣
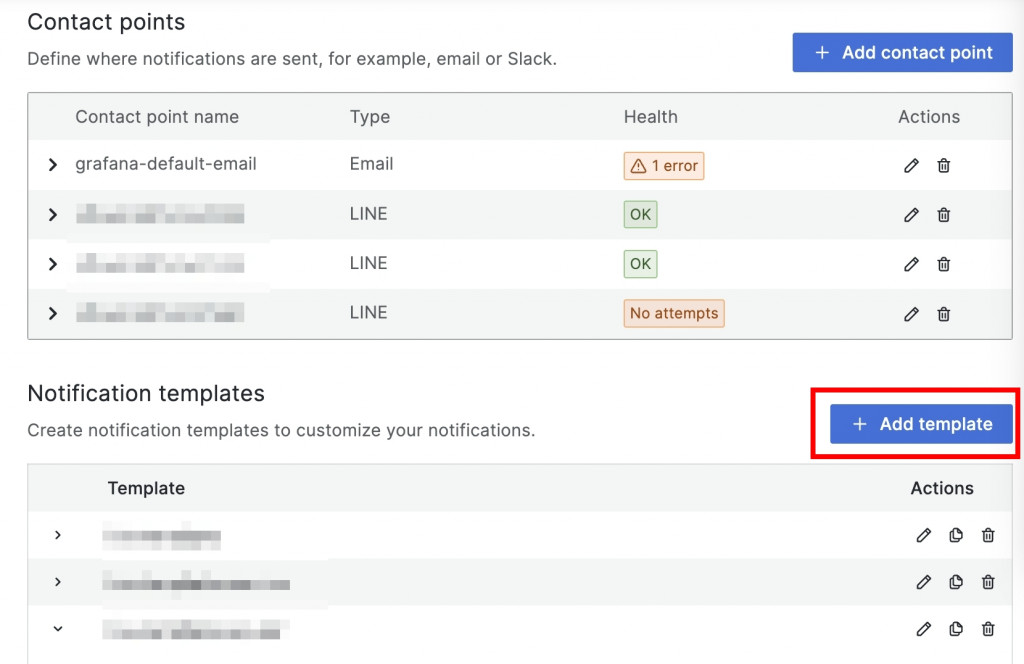
新增一個模板,命名為剛才有填寫的「line-template-test」
{{ define "line-template-test" }}
There are {{ len .Alerts.Firing }} firing alert(s), and {{ len .Alerts.Resolved }} resolved alert(s)

{{ if .Alerts.Firing -}}
**********系統資源預警**********
Firing alerts:
{{- range .Alerts.Firing }}
- *事件: {{ .Annotations.summary }}
- *詳情: {{ .Labels.environment }} {{ .Labels.instance }} {{ .Labels.endpoint }} {{ .Labels.deployment }}
- *開始時間: {{ (.StartsAt.Add 28800e9).Local.Format "2006-01-02 15:04:05" }}
- *當前值: {{ printf "%.0f" .Values.B }}%

{{ if gt (len .DashboardURL ) 0 }}
查看面板: {{ .DashboardURL }}
{{ end }}

{{- end }}
{{- end }}

{{ if .Alerts.Resolved -}}
**********系統恢復通知**********
Resolved alerts:
{{- range .Alerts.Resolved }}
- *事件: {{ .Annotations.summary }}
- *詳情: {{ .Labels.environment }} {{ .Labels.instance }} {{ .Labels.endpoint }} {{ .Labels.deployment }}
- *結束時間: {{ (.EndsAt.Add 28800e9).Local.Format "2006-01-02 15:04:05" }}

{{ if gt (len .DashboardURL ) 0 }}
查看面板: {{ .DashboardURL }}
{{ end }}

{{- end }}
{{- end }}

{{ end }}
這個時候再送出Test通知應該會長這樣
有抓到值的就會打印出值,沒有抓到值的就不會打印

關於告警規則與模板也是水滿深的一塊,可以再多多摸索~