gt的核心概念是將Pandas及Polars DataFrame以GT object包裹起來後,不斷透過其所提供的功能,來漸進式構築表格的各個部位。
gt將表格分為幾個component,而每個component內又有若干小component,如下圖所示:

以下我們將用一個簡單的例子,來展示經典的gt使用方式。
以Polars建立df:
import polars as pl
from great_tables import GT, html, md, style, loc
from great_tables.data import gtcars


df = pl.from_pandas(gtcars.sample(5, random_state=42)).select(
    "mfr", "model", "year", "hp", "trq", "msrp"
)
shape: (5, 6)
┌──────────────┬──────────┬────────┬───────┬───────┬──────────┐
│ mfr          ┆ model    ┆ year   ┆ hp    ┆ trq   ┆ msrp     │
│ ---          ┆ ---      ┆ ---    ┆ ---   ┆ ---   ┆ ---      │
│ str          ┆ str      ┆ f64    ┆ f64   ┆ f64   ┆ f64      │
╞══════════════╪══════════╪════════╪═══════╪═══════╪══════════╡
│ Aston Martin ┆ Vantage  ┆ 2016.0 ┆ 430.0 ┆ 361.0 ┆ 103300.0 │
│ Tesla        ┆ Model S  ┆ 2017.0 ┆ 259.0 ┆ 243.0 ┆ 74500.0  │
│ Aston Martin ┆ Vanquish ┆ 2016.0 ┆ 568.0 ┆ 465.0 ┆ 287250.0 │
│ Porsche      ┆ Panamera ┆ 2016.0 ┆ 310.0 ┆ 295.0 ┆ 78100.0  │
│ Aston Martin ┆ DB11     ┆ 2017.0 ┆ 608.0 ┆ 516.0 ┆ 211195.0 │
└──────────────┴──────────┴────────┴───────┴───────┴──────────┘
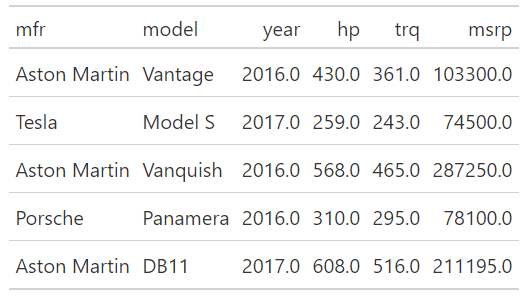
GT包裹df,生成預設的表格。GT(df)
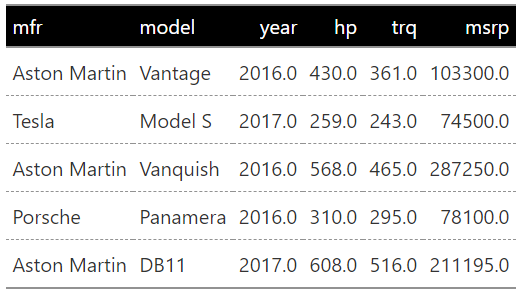
GT.opt_stylize()來調整表格整體風格。(
...
.opt_stylize(style=3, color="gray")
)
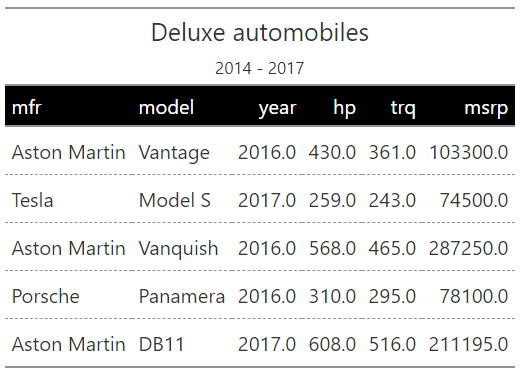
GT.tab_header()添加表格標題及副標題。(
...
.tab_header("Deluxe automobiles", "2014 - 2017")
)
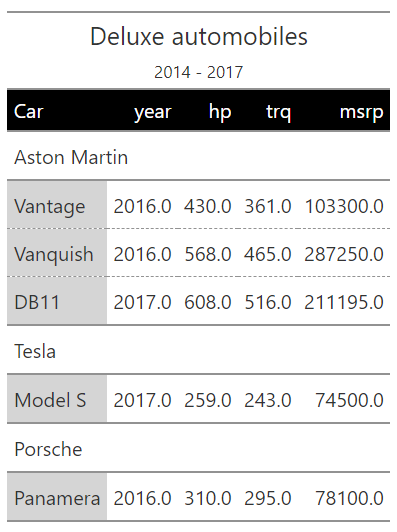
GT.tab_stub()指定分類,以「"mfr"」欄為分類目標,並以「"model"」欄為行之呈現依據。GT.tab_stubhead()指定分類標題。(
...
.tab_stub(groupname_col="mfr", rowname_col="model")
.tab_stubhead(label="Car")
)
GT.tab_spanner()添加表格階層至「"hp"」欄及「"trq"」欄。(
...
.tab_spanner(label=html("<i>Performance</i>"), columns=["hp", "trq"])
)
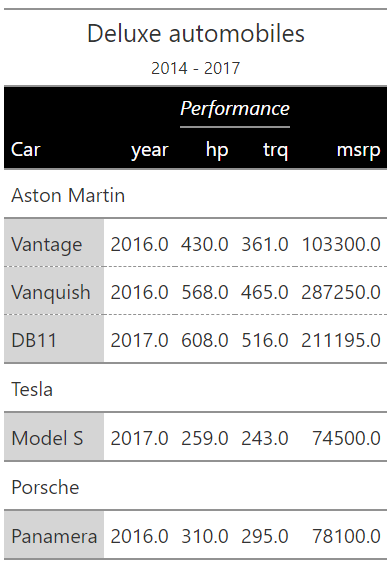
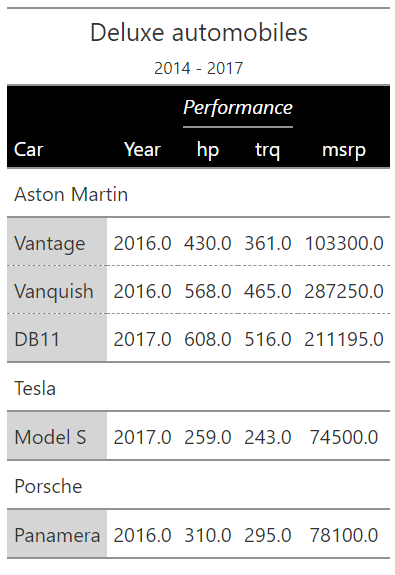
GT.cols_label()來調整「"year"」欄的欄位名稱。GT.cols_align()來對齊所有欄位。(
...
.cols_label(year="Year")
.cols_align("center")
)
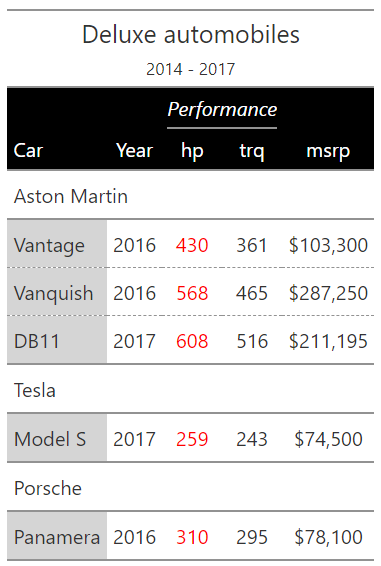
GT.fmt_integer()來調整「"year"」欄的整數呈現方式。GT.fmt_integer()來調整「"hp"」及「"trq"」欄的整數呈現方式。GT.fmt_currency()來調整「"msrp"」欄的貨幣呈現方式。GT.tab_style()來改變「"hp"」欄的文字顏色為紅色。(
...
.fmt_integer("year", use_seps=False)
.fmt_integer(["hp", "trq"])
.fmt_currency("msrp", decimals=0)
.tab_style(
style=style.text(color="red"), locations=loc.body(columns="hp")
)
)
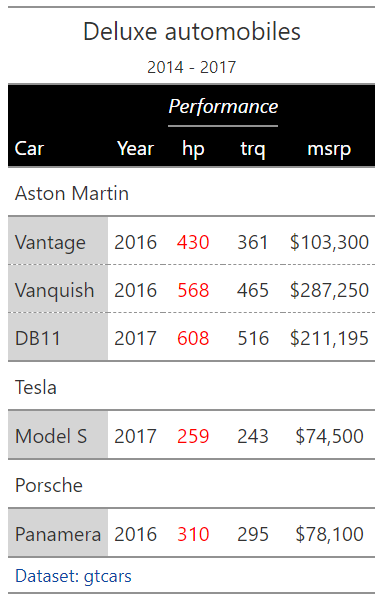
GT.tab_source_note()來添加註解。(
...
.tab_source_note(
md(
"[Dataset: gtcars](https://posit-dev.github.io/great-tables/reference/data.gtcars.html#great_tables.data.gtcars)"
)
)
)
gt一直致力於減少對各package的依賴,即使Pandas及Polars也非強依賴,用戶可以選擇只安裝Pandas或只安裝Polars。
目前dependency部份,有兩個issue正在努力:
DF.read_csv()功能讀入。團隊正在思考是否改採用lazy方式讀入,免除若想使用內建dataset就必須安裝Pandas的情況。由於gt內部是以迴圈方式來修改表格,並不是向量化的操作。所以傳入GT的DataFrame不宜過大,否則需時良久(註1)。此外,gt的主要功能為產生易讀美觀的表格而非提供DataFrame層級的操作。
註1:gt開發團隊正在思考導入ibis或narwhals來作為各種DataFrame的中介層,或許能因此大幅提升gt的渲染速度。