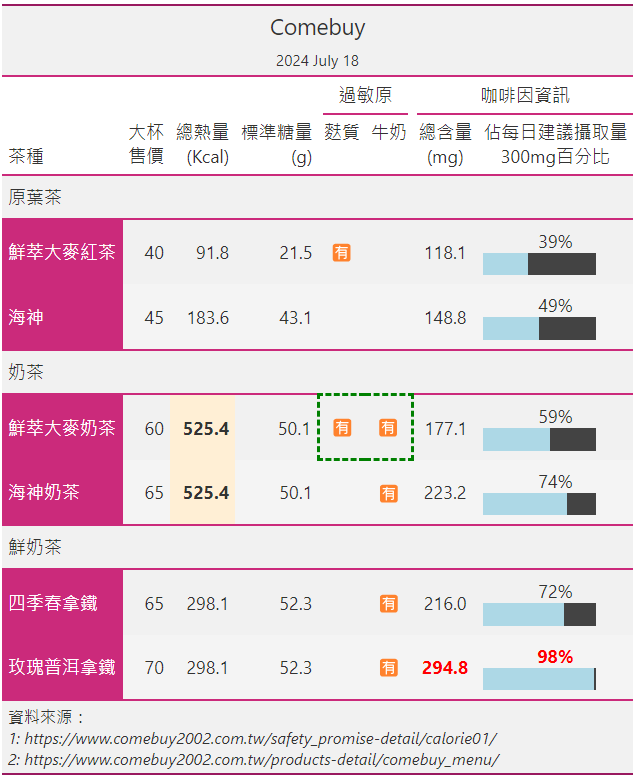
今天我們試著來製作一張簡易的手搖飲品表,表中會包含飲品價格、熱量、糖量、是否添加過敏原及咖啡因含量等資訊(註1)。
本日成果預覽如下:
首先自官網收集飲品相關資訊:
import csv
import polars as pl
from great_tables import GT, html, style, loc
import polars.selectors as cs


input_filename = "comebuy.csv"
columns = [
    "類別",
    "品名",
    "總熱量(Kcal)",
    "標準糖量(g)",
    "咖啡因總含量(mg)",
    "過敏原_麩質製品",
    "過敏原_牛奶製品",
    "售價(大杯)",
]


def _collect_data(filename) -> None:
    data = [
        dict(
            zip(
                columns,
                ("原葉茶", "鮮萃大麥紅茶", 91.8, 21.5, 118.1, "Y", "N", 40),
            )
        ),
        dict(
            zip(
                columns,
                ("原葉茶", "海神", 183.6, 43.1, 148.8, "N", "N", 45),
            )
        ),
        dict(
            zip(
                columns,
                ("奶茶", "鮮萃大麥奶茶", 525.4, 50.1, 177.1, "Y", "Y", 60),
            )
        ),
        dict(
            zip(
                columns,
                ("奶茶", "海神奶茶", 525.4, 50.1, 223.2, "N", "Y", 65),
            )
        ),
        dict(
            zip(
                columns,
                ("鮮奶茶", "四季春拿鐵", 298.1, 52.3, 216.0, "N", "Y", 65),
            )
        ),
        dict(
            zip(
                columns,
                ("鮮奶茶", "玫瑰普洱拿鐵", 298.1, 52.3, 294.8, "N", "Y", 70),
            )
        ),
    ]

    # suggest assigning `encoding` and `newline` in the Windows systems
    with open(filename, "w", encoding="utf-8", newline="\n") as f:
        writer = csv.DictWriter(f, fieldnames=columns)
        writer.writeheader()
        writer.writerows(data)


_collect_data(input_filename)
定義一個_collect_data()函數,接受filename為參數。此處我們選取六款飲品,將每個單品資訊收集為一個dict並集合成一個data列表。接著使用Python內建的csv.DictWriter,將data寫入到comebuy.csv。
comebuy.csv預覽如下:
類別,品名,總熱量(Kcal),標準糖量(g),咖啡因總含量(mg),過敏原_麩質製品,過敏原_牛奶製品,售價(大杯)
原葉茶,鮮萃大麥紅茶,91.8,21.5,118.1,Y,N,40
原葉茶,海神,183.6,43.1,148.8,N,N,45
奶茶,鮮萃大麥奶茶,525.4,50.1,177.1,Y,Y,60
奶茶,海神奶茶,525.4,50.1,223.2,N,Y,65
鮮奶茶,四季春拿鐵,298.1,52.3,216.0,N,Y,65
鮮奶茶,玫瑰普洱拿鐵,298.1,52.3,294.8,N,Y,70
接著使用comebuy.csv來製作出DataFrame:
allergy_cols = cs.contains("過敏原")
caffeine_cols = cs.contains("咖啡因")


def create_bar(
    df_: pl.DataFrame, max_width: int, height: int
) -> pl.DataFrame:
    tmp_columns = {
        "div_before": (
            pl.lit(f"""\
            <div style="width: {max_width}px; background-color: #434343;">\
                <div style="height:{height}px;width:
            """)
        ),
        "px_width": (
            pl.col("咖啡因總含量(mg)")
            .truediv(300)
            .mul(max_width)
            .round(2)
            .cast(pl.Utf8)
            .add("px")
        ),
        "div_after": (
            pl.lit("""\
            ;background-color:lightblue;"></div>\
            </div>
            """)
        ),
    }
    return df_.with_columns(
        **tmp_columns,
        caff_perc=pl.col("咖啡因總含量(mg)")
        .truediv(300)
        .mul(100)
        .cast(pl.Int64),
    ).select(
        *df_.columns,
        "caff_perc",
        pl.col("caff_perc")
        .cast(pl.Utf8)
        .add("%")
        .add(pl.concat_str(tmp_columns))
        .alias("咖啡因佔每日建議攝取量(%)"),
    )


def tweak_df(filename: str) -> pl.DataFrame:
    return (
        pl.read_csv(filename)
        .with_columns(allergy_cols.str.replace_many(["N", "Y"], ["", "🈶"]))
        .pipe(create_bar, max_width=100, height=20)
    )


df = tweak_df("comebuy.csv")

分段說明如下:
allergy_cols來選取欄位名中有「"過敏原"」的欄位;同理,定義caffeine_cols來選取欄位名中有「"咖啡因"」的欄位。create_bar()函數(註2)來為所傳入df_添加「"caff_perc"」及「"咖啡因佔每日建議攝取量"」兩個欄位。其中「"caff_perc"」 欄位為咖啡因佔每日建議攝取量的數值,而「"咖啡因佔每日建議攝取量(%)"」 欄位則是將會由gt渲染成HTML的字串形式,其中大多為css的設定。這裡使用的pl.concat_str()是一個能夠將多個欄位連接成一個型態為pl.String欄位的好用工具。tweak_df()函數,其接收一個filename變數,並返回一個DataFrame。
comebuy.csv。allergy_cols中的字串。當字串為「"N"」時,取代為空字串;而當字串為「"Y"」時,則取代為「"🈶"」這個emoji。create_bar()函數,並指定max_width及height兩個控制css的參數。在產生df之後,以下面這段程式碼來製作gt表格:
def make_gt(df: pl.DataFrame) -> GT:
    return (
        GT(df)
        .tab_header("Comebuy", "2024 July 18")
        .tab_stub(rowname_col="品名", groupname_col="類別")
        .tab_stubhead("茶種")
        .tab_spanner(label="過敏原", columns=allergy_cols)
        .tab_spanner(label="咖啡因資訊", columns=caffeine_cols)
        .tab_options(table_background_color="#F1F1F1")
        .cols_label(
            **{
                "總熱量(Kcal)": html("總熱量<br>(Kcal)"),
                "標準糖量(g)": html("標準糖量<br>(g)"),
                "咖啡因總含量(mg)": html("總含量<br>(mg)"),
                "咖啡因佔每日建議攝取量(%)": html(
                    "佔每日建議攝取量<br>300mg百分比"
                ),
                "過敏原_麩質製品": html("麩質<br></br>"),
                "過敏原_牛奶製品": html("牛奶<br></br>"),
                "售價(大杯)": html("大杯<br>售價"),
            }
        )
        .cols_move_to_start(
            ["售價(大杯)", "總熱量(Kcal)", "標準糖量(g)", allergy_cols]
        )
        .cols_align(align="center", columns=[allergy_cols, caffeine_cols])
        .cols_hide("caff_perc")
        .tab_style(
            style=style.borders(
                sides=["top", "left", "bottom"],
                color="green",
                style="dashed",
                weight="3px",
            ),
            locations=loc.body(
                columns="過敏原_麩質製品",
                rows=pl.all_horizontal(allergy_cols.eq("🈶")),
            ),
        )
        .tab_style(
            style=style.borders(
                sides=["top", "right", "bottom"],
                color="green",
                style="dashed",
                weight="3px",
            ),
            locations=loc.body(
                columns="過敏原_牛奶製品",
                rows=pl.all_horizontal(allergy_cols.eq("🈶")),
            ),
        )
        .tab_style(
            style=[style.text(color="red"), style.text(weight="Bold")],
            locations=loc.body(
                columns=caffeine_cols, rows=pl.col("caff_perc").gt(80)
            ),
        )
        .tab_style(
            style=[style.fill(color="papayawhip"), style.text(weight="Bold")],
            locations=loc.body(
                columns="總熱量(Kcal)", rows=pl.col("總熱量(Kcal)").gt(500)
            ),
        )
        .tab_source_note(
            html("""\
             資料來源:
            <I>
            <br>
            1: https://www.comebuy2002.com.tw/safety_promise-detail/calorie01/
            <br>
            2: https://www.comebuy2002.com.tw/products-detail/comebuy_menu/
            </i>\
            """)
        )
        .opt_stylize(style=1, color="pink")
    )


gtbl = make_gt(df)
定義一個make_gt()函數,其接收df為參數並回傳GT instance。內部程式分段說明如下:
GT.tab_header()加入標題「"Comebuy"」及副標題「"2024 July 18"」。GT.tab_stub()加入分類,rowname_col指定為「"品名"」欄, groupname_col則指定為「"類別"」欄。GT.tab_stubhead()設定分類標題為「"茶種"」。GT.tab_spanner()設定「"過敏原"」及「"咖啡因資訊"」兩個階層。GT.tab_options()設定表格背景顏色為「"#F1F1F1"」。GT.cols_label()重新命名多個欄位名稱。GT.cols_move_to_start()將數個欄位移至最前。GT.cols_align()設定allergy_cols及caffeine_cols皆為中央對齊。GT.hide()隱藏「"caff_perc"」欄。GT.tab_style()來調整表格框線、顏色與強調的部份。GT.tab_source_note()來列出兩個參考資料網址。GT.opt_stylize()導入gt提供的佈景主題,style參數設定為「1」,color參數則設為「"Pink"」。最後編寫一個_write_html()函數,其接收gtbl及filename作為參數。其內透過呼叫gtbl.as_raw_html()將製作好的表格輸出為HTML格式並寫入filename檔案中。
output_filename = "comebuy.html"


def _write_html(gtbl: GT, filename: str) -> None:
    with open(filename, "w") as f:
        f.write(gtbl.as_raw_html())


_write_html(gtbl, output_filename)
註1:表格資訊皆取自COMEBUY官網。由於資訊可能隨時間有所更新且小弟可能有繕打錯誤,建議有意購買的朋友移駕官網取得第一手資訊。此外,小弟並無宣傳推廣此家飲品之意,僅是希望將其作為生活化之製表範例。
註2:create_bar()函數的靈感源自於官方範例中的Highest Paid Athletes in 2023。
