今天我們來說明如何將gt表格呈現於Streamlit app中。
本日程式碼將存在main.py檔中,內容參考自官方Solar Zenith Angles範例。
get_sza()函數get_sza()會返回一個Polars DataFrame,是由gt提供的sza Pandas DataFrame轉換而來。由於DataFrame於此app中不會變動,所以可以將@st.cache_data(註1)裝飾在get_sza()上。
import polars as pl
import streamlit as st
from great_tables.data import sza


@st.cache_data
def get_sza():
    return pl.from_pandas(sza)
get_sza_gt()函數get_sza_gt()中為Polars DataFrame的整理過程及表格的製作過程。
from great_tables import GT, html
def get_sza_gt():
sza_pivot = (
get_sza()
.filter((pl.col("latitude") == "20") & (pl.col("tst") <= "1200"))
.select(pl.col("*").exclude("latitude"))
.drop_nulls()
.pivot(values="sza", index="month", on="tst", sort_columns=True)
)
return (
GT(sza_pivot, rowname_col="month")
.data_color(
domain=[90, 0],
palette=["rebeccapurple", "white", "orange"],
na_color="white",
)
.tab_header(
title="Solar Zenith Angles from 05:30 to 12:00",
subtitle=html("Average monthly values at latitude of 20°N."),
)
.sub_missing(missing_text="")
)
st.write()呈現表格st.title("Great Tables shown in Streamlit")
st.write(get_sza_gt().as_raw_html(), unsafe_allow_html=True)
get_sza_gt().as_raw_html()為整合的關鍵。我們使用GT.as_raw_html()來生成HTML,並置於st.write中。此外,這邊必須要將unsafe_allow_html參數設定為True,此舉是告訴Streamlit,我們所提供的HTML是安全的,請照實呈現。
於命令列中執行下列指令:
streamlit run main.py
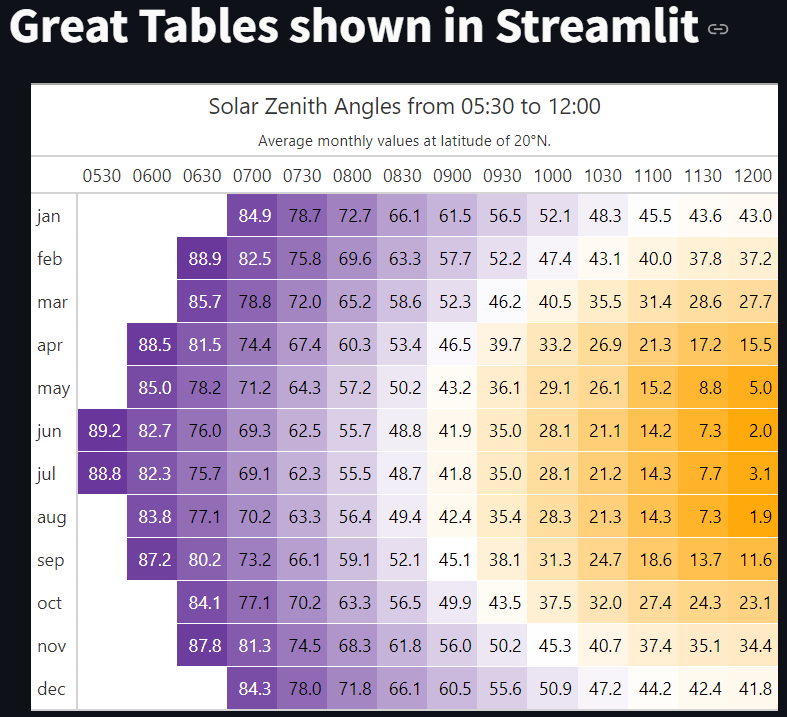
接著打開瀏覽器前往預設網址,如http://127.0.0.1:8000/,就可以見到下面這個漂亮的表格:

如果覺得每次使用st.write(),都要記得使用GT.as_raw_html()作為輸入並設定unsafe_allow_html參數為True很麻煩的話,可以參考下面這個裝飾器的寫法:
from functools import wraps
import polars as pl
import streamlit as st
from great_tables import GT, html
from great_tables.data import sza
def gt2streamlit(func):
@wraps(func)
def wrapper(*args, **kwargs):
gtbl = func(*args, **kwargs)
gtbl_html = gtbl.as_raw_html()
return st.write(gtbl_html, unsafe_allow_html=True)
return wrapper
@st.cache_data
def get_sza():
return pl.from_pandas(sza)
@gt2streamlit
def st_write_gt(df):
sza_pivot = (
df
.filter((pl.col("latitude") == "20") & (pl.col("tst") <= "1200"))
.select(pl.col("*").exclude("latitude"))
.drop_nulls()
.pivot(values="sza", index="month", on="tst", sort_columns=True)
)
return (
GT(sza_pivot, rowname_col="month")
.data_color(
domain=[90, 0],
palette=["rebeccapurple", "white", "orange"],
na_color="white",
)
.tab_header(
title="Solar Zenith Angles from 05:30 to 12:00",
subtitle=html("Average monthly values at latitude of 20°N."),
)
.sub_missing(missing_text="")
)
st.title("Great Tables shown in Streamlit")
st_write_gt(get_sza())
這裡我們希望能夠建立st_write_gt()來代替st.write(),其接收一個GT instance,並藉由所裝飾的@gt2streamlit來完成上述兩項工作,即以GT.as_raw_html()作為st.write()輸入及設定unsafe_allow_html參數為True。
如果對裝飾器這個概念仍然不是那麼清楚的朋友,可以參考我於2023年鐵人賽的系列文 ── Python十翼:與未來的自己對話,其中有詳細的說明。
註1:其實Streamlit中還有一個st.cache_resource功能。兩者的使用時機,可以參考官方文件關於cache的解釋,我們這邊應該比較適合使用st.cache_data。
本日所有程式碼可參考gt-streamlit repo。
