今天將會細部說明如何製作表格。步驟裡的每一個過程,都會附上該步驟完成時的圖片,希望能夠幫助大家更加了解gt的各種功能。如果覺得太小的話,請右鍵開啟新網頁或是觀看英文版內的放大圖片。
此外,今天各步驟輸出的過程皆包含在make_table()函數中,故不另闢小節說明。
make_table()make_table()主要接收一個GT instance,以及一連串函數。這些函數內部會呼叫GT.*()來調整表格設定,並返回調整過後的GT instance,也就是「GT in,GT out」。
當呼叫make_table()時,會依序呼叫所傳入內的函數使其發生作用,並於最後回傳經過多個函數調整後的GT instance。這樣的寫法很有彈性,使我們可以添加任意數量的函數來調整表格,並且很容易地就可以調整函數的前後順序。
此外,make_table()在調整表格的過程中,也會將各步驟的結果存為PNG檔。
def make_table(
    gtbl: GT,
    *funcs: Callable[[GT], GT] | Iterable[Callable[[GT], GT]],
    tbl_dir: str | Path = "tables",
    save_png: bool = False,
) -> GT:
    first = funcs[0]
    if isinstance(first, Iterable) and len(funcs) == 1:
        funcs = first

    table_dir = Path(tbl_dir)
    table_dir.mkdir(exist_ok=True)

    for i, func in enumerate(funcs, start=1):
        gtbl = func(gtbl)
        if save_png:
            gtbl.save(str(table_dir / f"{i:02}_{func.__name__}.png"))
    return gtbl
為方便操作,我們在此定義了大部份之後會用到的變數:
class EuroNCAPPalette(str, Enum):
TABLE_BACKGROUND: str = "#F5F5F5"
HIGHLIGHT1: str = "#C0DA80"
HIGHLIGHT2: str = "#C3EBD7"
HIGHLIGHT3: str = "#A0E0D0"
STUB_COLUMN_LABEL: str = "#D4E6A8"
ROW_GROUP: str = "#BFE2A7"
CELL: str = "#F4FAF1"
TITLE: str = "#30937B"
GRADIENT1: str = "#E7CE91"
GRADIENT2: str = "#F2E4C0"
GRADIENT3: str = "#F5EFE7"
domain_nominal_max = {
"Frontal Impact": 16,
"Lateral Impact": 16,
"Rear Impact": 4,
"Rescue and Extrication": 4,
"Crash Test Performance": 24,
"Safety Features": 13,
"CRS Installation Check": 12,
"VRU Impact Protection": 36,
"VRU Impact Mitigation": 27,
"Speed Assistance": 3,
"Occupant Status Monitoring": 3,
"Lane Support": 3,
"AEB Car-to-Car": 9,
}
adult_occupant_top_score = 40
adult_occupant_labels = zip(
adult_occupant_columns,
(
html(
f"Frontal<br>Impact<br><i>({domain_nominal_max['Frontal Impact']}/{adult_occupant_top_score})</i>"
),
html(
f"Lateral<br>Impact<br><i>({domain_nominal_max['Lateral Impact']}/{adult_occupant_top_score})</i>"
),
html(
f"Rear<br>Impact<br><i>({domain_nominal_max['Rear Impact']}/{adult_occupant_top_score})</i>"
),
html(
f"Rescue&<br>Extrication<br><i>({domain_nominal_max['Rescue and Extrication']}/{adult_occupant_top_score})</i>"
),
),
)
child_occupant_top_score = 49
child_occupant_labels = zip(
child_occupant_columns,
(
html(
f"Crash<br>Test<br><i>({domain_nominal_max['Crash Test Performance']}/{child_occupant_top_score})</i>"
),
html(
f"Safety<br>Features<br><i>({domain_nominal_max['Safety Features']}/{child_occupant_top_score})</i>"
),
html(
f"CRS<br>Installation<br>Check<br><i>({domain_nominal_max['CRS Installation Check']}/{child_occupant_top_score})</i>"
),
),
)
vulnerable_road_users_score = 63
vulnerable_road_users_labels = zip(
vulnerable_road_users_columns,
(
# add empty space
html(
f"Impact <br>Protection <br><i>({domain_nominal_max['VRU Impact Protection']}/{vulnerable_road_users_score}) </i>"
),
html(
f"Impact <br>Mitigation <br><i>({domain_nominal_max['VRU Impact Mitigation']}/{vulnerable_road_users_score}) </i>"
),
),
)
safety_assist_score = 18
safety_assist_labels = zip(
safety_assist_columns,
(
html(
f"Speed<br>Assistance<br><i>({domain_nominal_max['Speed Assistance']}/{safety_assist_score})</i>"
),
html(
f"Occupant<br>Status<br>Monitoring<br><i>({domain_nominal_max['Occupant Status Monitoring']}/{safety_assist_score})</i>"
),
html(
f"Lane<br>Support<br><i>({domain_nominal_max['Lane Support']}/{safety_assist_score})</i>"
),
html(
f"AEB C2C<b><i><sup>3</sup></i></b><br><i>({domain_nominal_max['AEB Car-to-Car']}/{safety_assist_score})</i>"
),
),
)
testing_labels = dict(
chain(
adult_occupant_labels,
child_occupant_labels,
vulnerable_road_users_labels,
safety_assist_labels,
)
)
由於我們只是想透過make_table()來存入預設的表格,所以直接返回所接收的GT instance,不做其它操作。
def default_table(gtbl: GT) -> GT:
    return gtbl

grouping_table()grouping_table()的目的為添加表格分類,指定groupname_col為「"Class"」欄及rowname_col為「"Model"」欄。由於在參賽時,gt尚未有GT.tab_stub()可以使用,所以這邊取巧地使用gtbl._tbl_data來獲取底層的DataFrame。
def grouping_table(
    gtbl: GT, groupname_col: str = "Class", rowname_col: str = "Model"
) -> GT:
    return GT(gtbl._tbl_data, groupname_col=groupname_col, rowname_col=rowname_col)

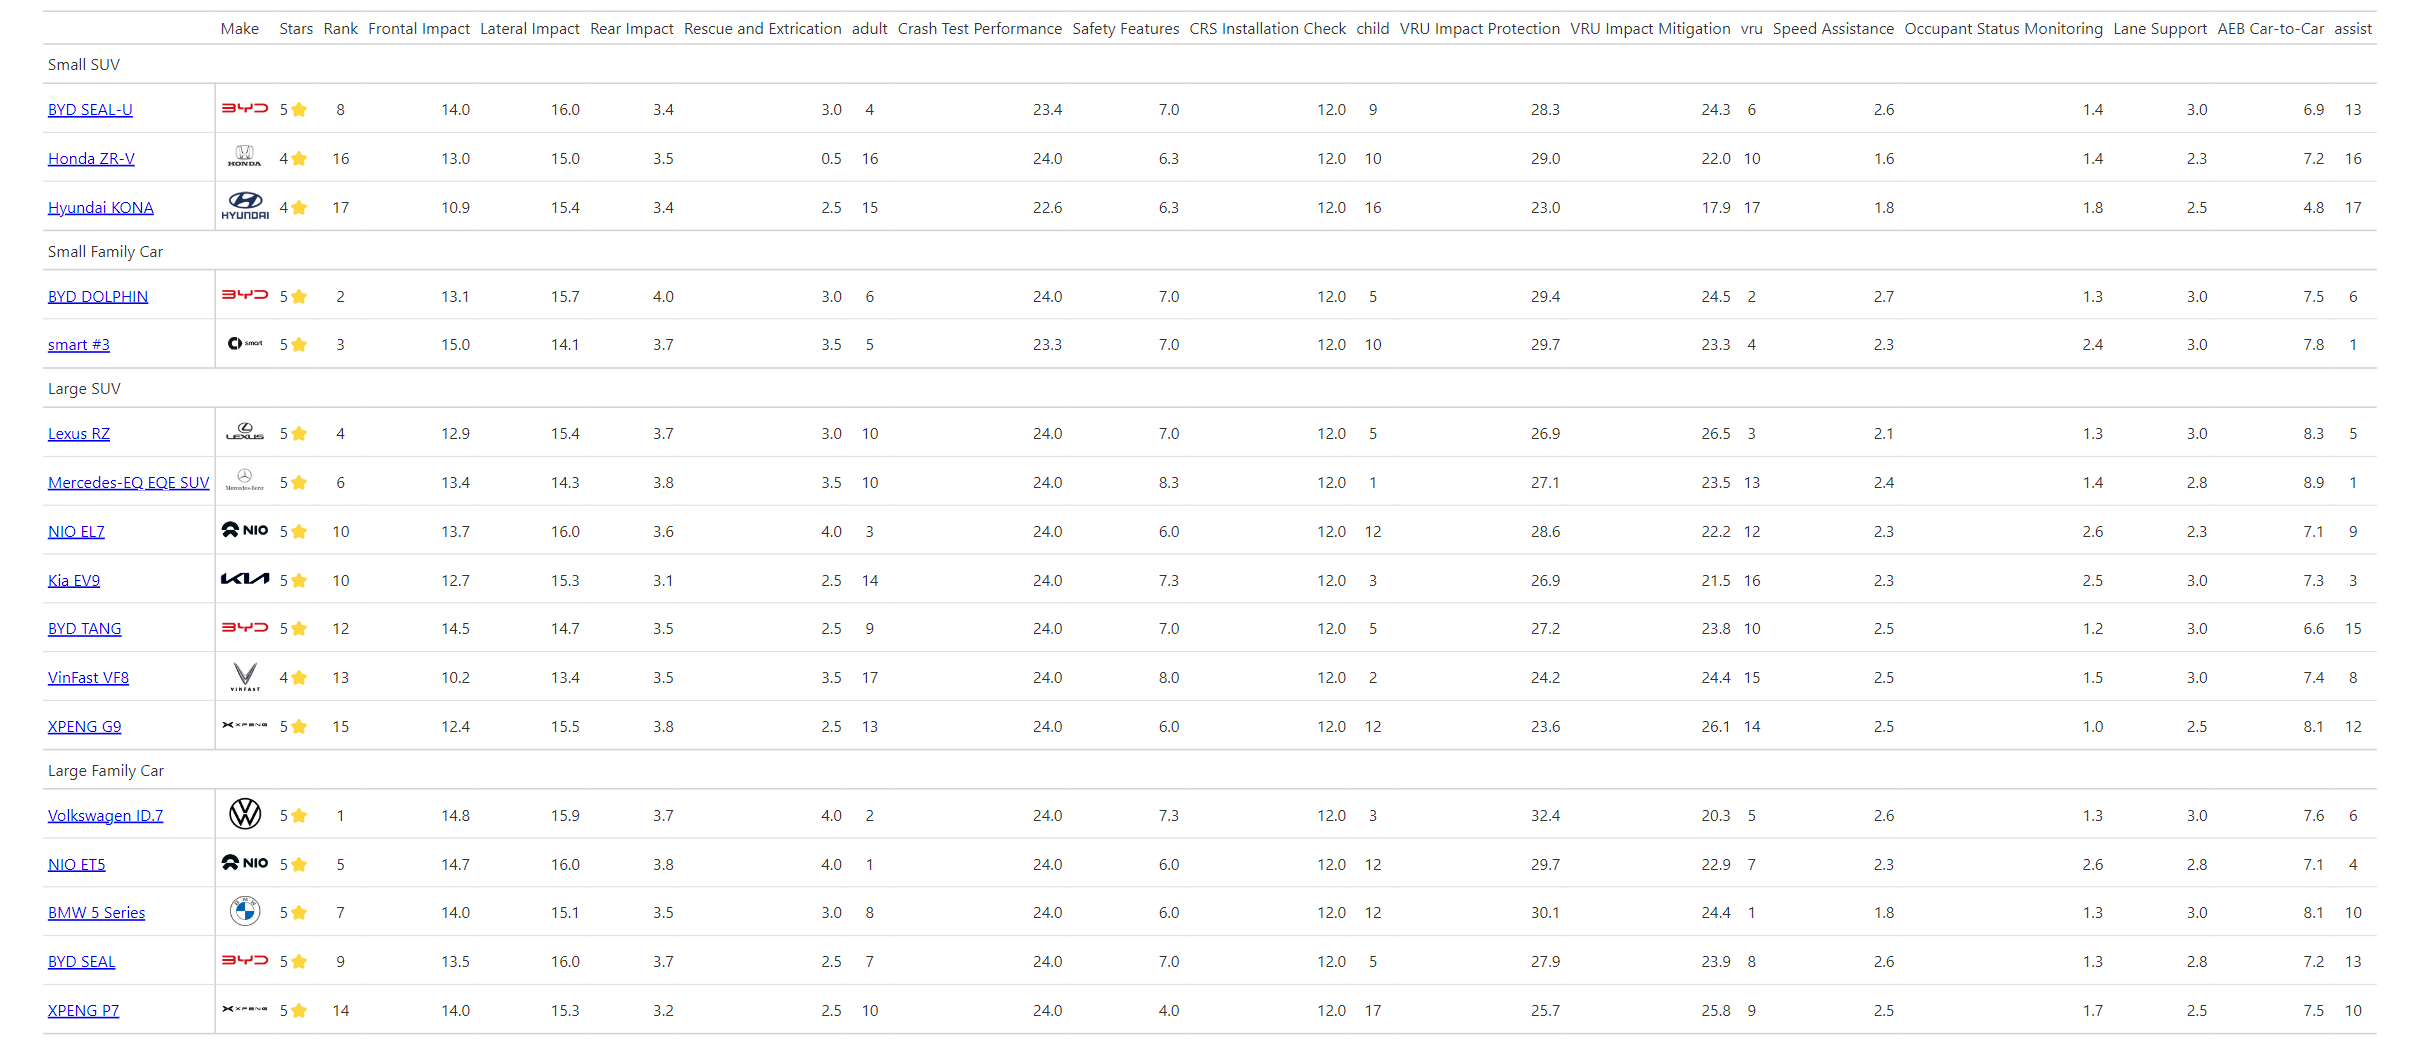
add_formatter()add_formatter()進行了三種格式設定:
GT.fmt_image("Make", path=logo_path)來顯示「"Make"」欄中路徑所指的車商logo。GT.fmt_number(columns=testing_columns, decimals=1)來將testing_columns中所有欄位設定為顯示一位小數。GT.fmt_markdown(columns=["Model"])來渲染「"Model"」欄位,使其各行成為能夠被點擊的連結。def add_formatter(gtbl: GT) -> GT:
return (
gtbl.fmt_image("Make", path=logo_path)
.fmt_number(columns=testing_columns, decimals=1)
.fmt_markdown(columns=["Model"])
)
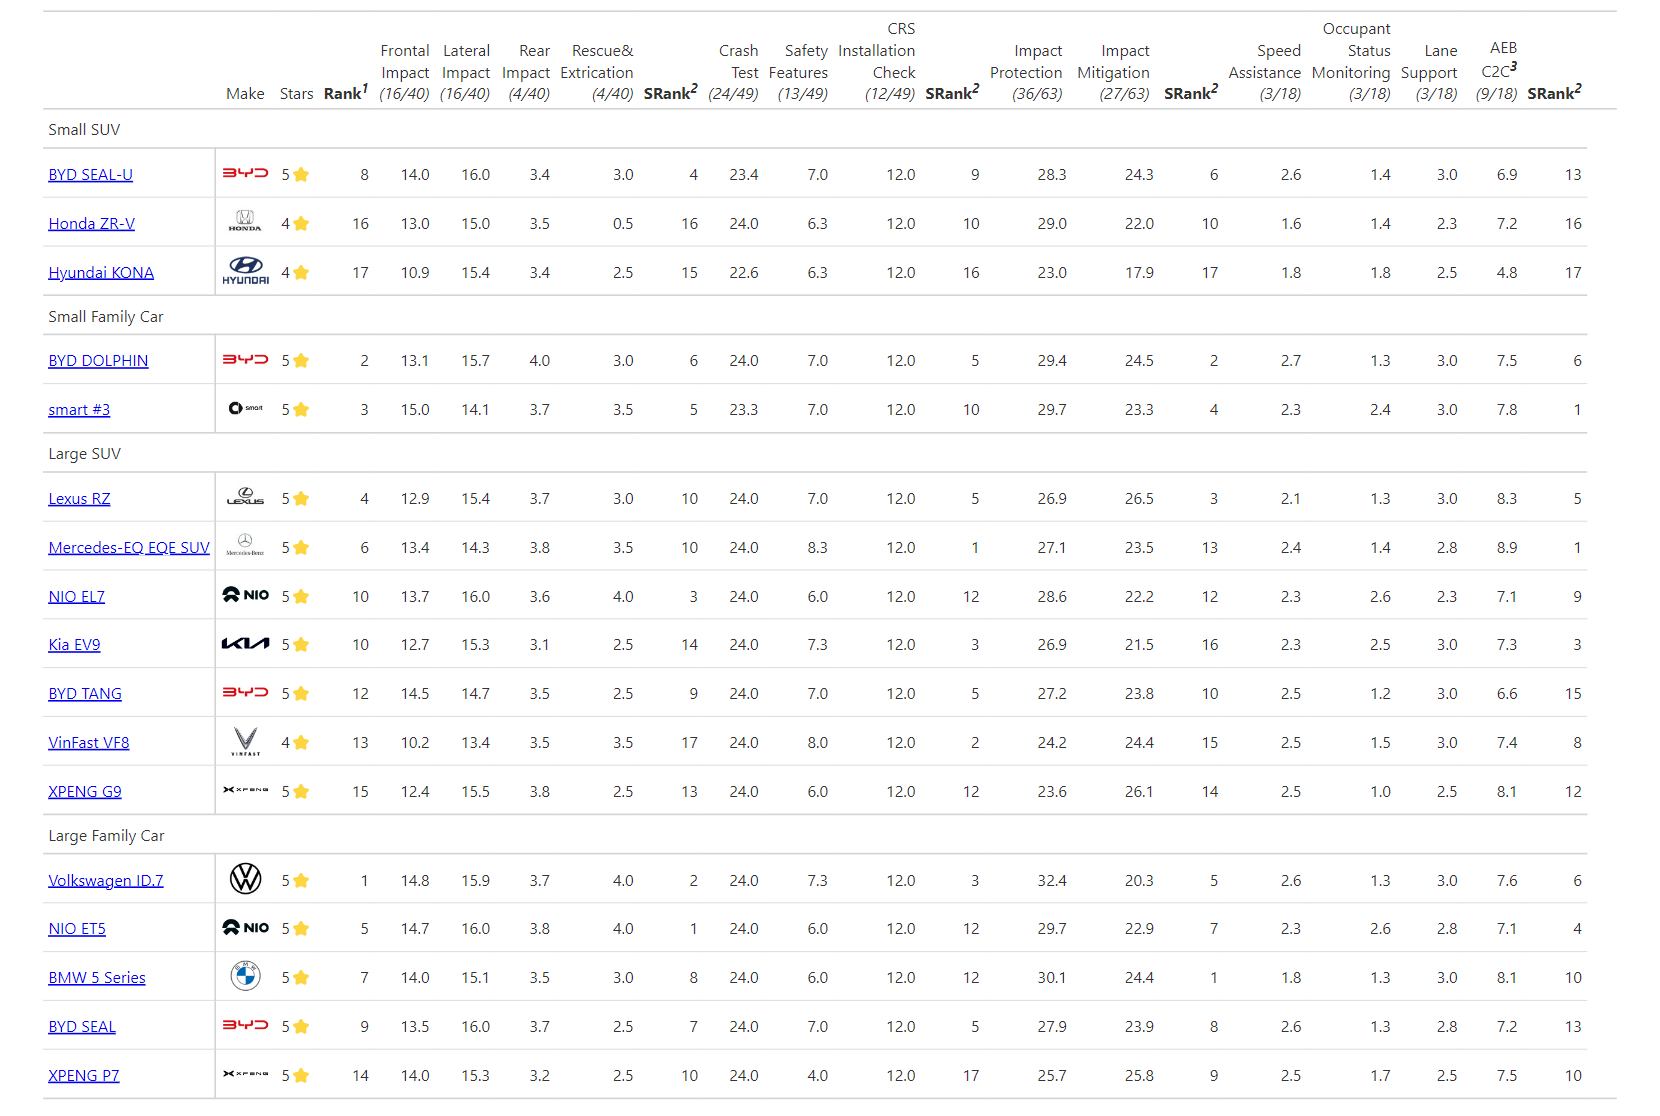
adjust_cols()adjust_cols()做了下列欄位相關調整:
GT.cols_width(cols_width)調整了cols_width變數中所有欄位的寬度。GT.cols_align(align="center", columns=["Make", "Stars"])將「"Make"」與「"Stars"」欄位置中對齊。GT.cols_align(align="right", columns=["Rank", *testing_group_names])將「"Rank"」欄與testing_group_names中所有欄位靠右對齊。GT.cols_label(**cols_label)調整了大部份欄位的顯示名稱。def adjust_cols(gtbl: GT) -> GT:
cols_width = dict.fromkeys(testing_columns, "60px") | dict.fromkeys(
testing_group_names, "30px"
)
cols_label = (
{"Rank": html("<b>Rank<i><sup>1</sup></i></b>")}
| testing_labels
| dict.fromkeys(testing_group_names, html("<b>SRank<i><sup>2</sup></i></b>"))
)
return (
gtbl.cols_width(cols_width)
.cols_align(align="center", columns=["Make", "Stars"])
.cols_align(align="right", columns=["Rank", *testing_group_names])
.cols_label(**cols_label)
)
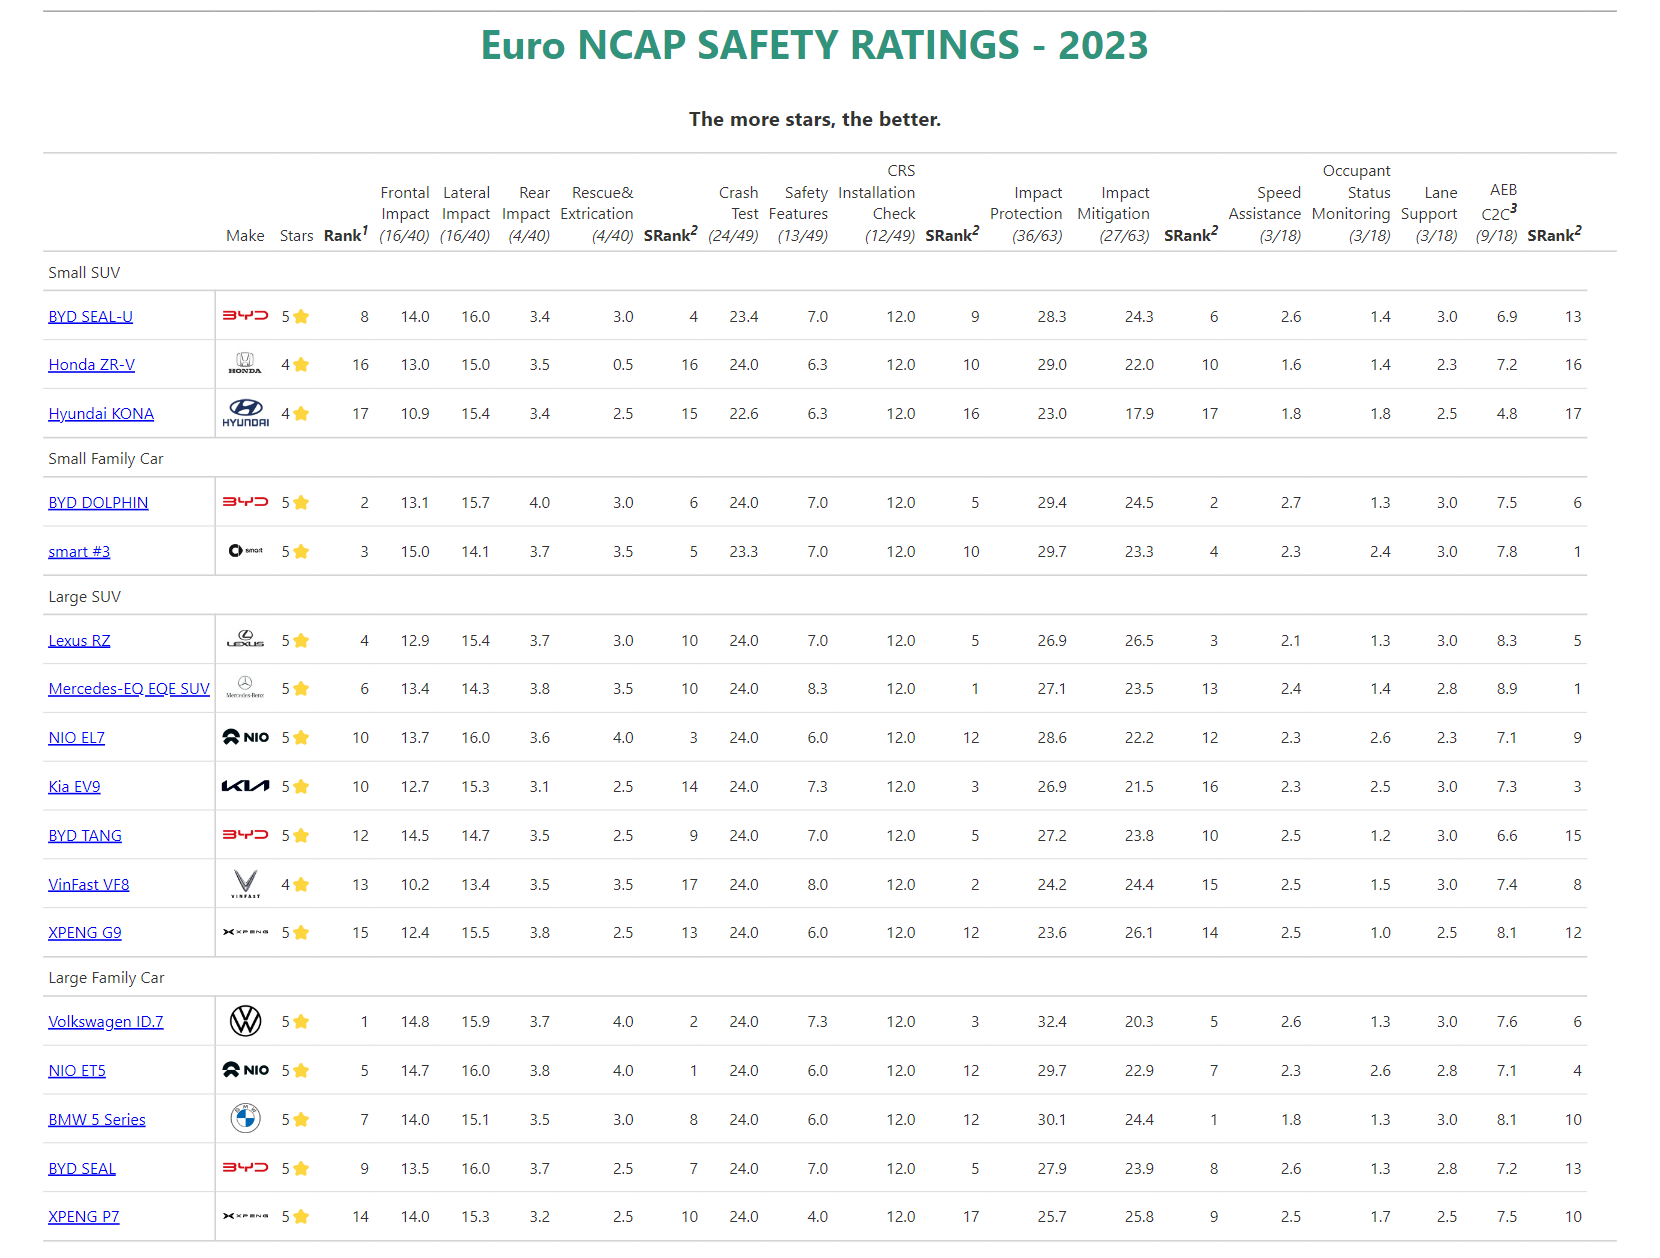
add_tab_header()add_tab_spanner()使用了GT.tab_header()來添加表格標題及副標題。
def add_tab_header(gtbl: GT) -> GT:
    return gtbl.tab_header(
        title=html(
            f"""<h1><span style="color: {EuroNCAPPalette.TITLE.value}">Euro NCAP SAFETY RATINGS - 2023</span></h1>"""
        ),
        subtitle=html("""<h2>The more stars, the better.</h2>"""),
    )
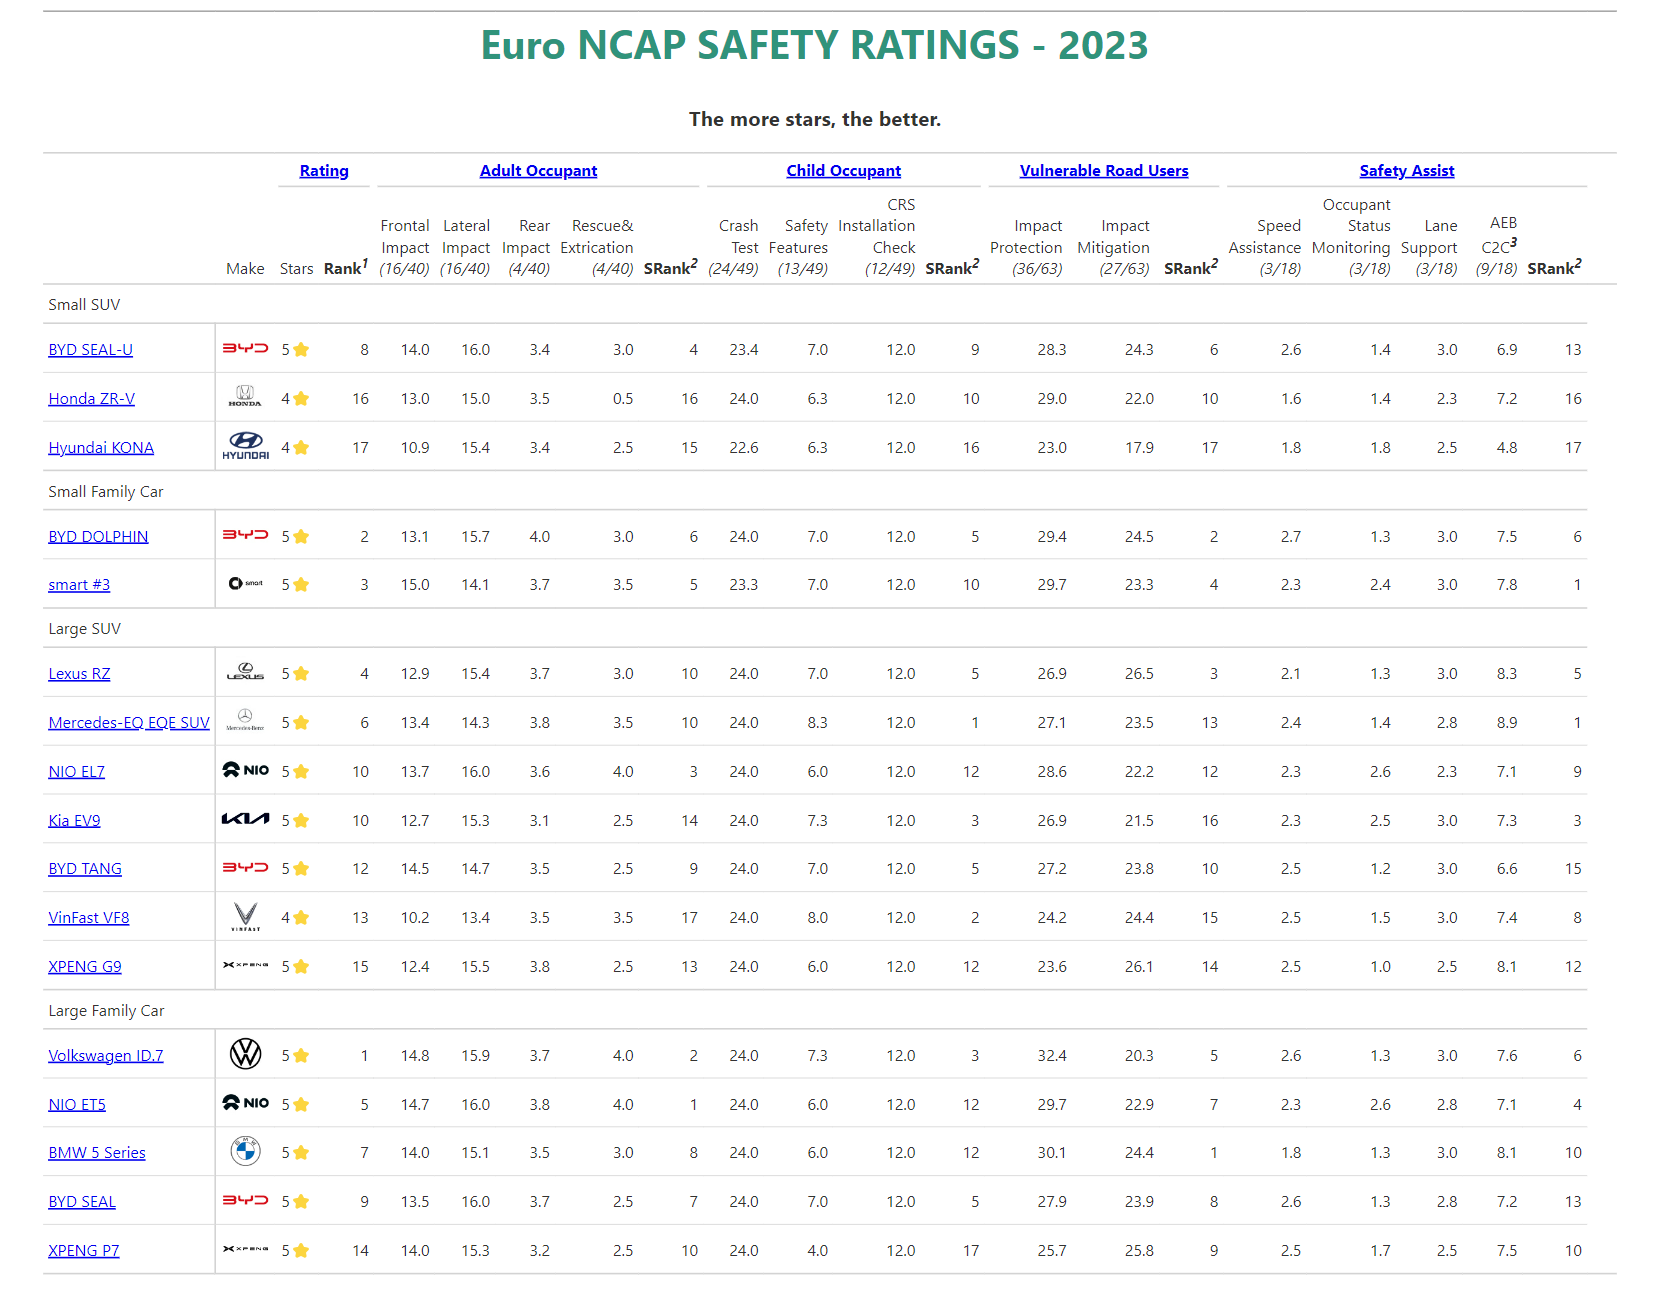
add_tab_spanner()add_tab_spanner()多次呼叫GT.tab_spanner()為表格添加階層。
def a_html(text: str, url: str, is_bold: bool = True, align: str = "center") -> html:
    fragment = '<a href="{url}" style="float: {align};">{text}</a>'
    if is_bold:
        fragment = f"<b>{fragment}</b>"
    return html(fragment.format(url=url, text=text, align=align))


def add_tab_spanner(gtbl: GT) -> GT:
    gtbl = gtbl.tab_spanner(
        a_html(
            "Rating", "https://www.euroncap.com/en/car-safety/the-ratings-explained/"
        ),
        columns=["Stars", "Rank"],
    )

    labels = (
        a_html(
            "Adult Occupant",
            "https://www.euroncap.com/en/car-safety/the-ratings-explained/adult-occupant-protection/",
        ),
        a_html(
            "Child Occupant",
            "https://www.euroncap.com/en/car-safety/the-ratings-explained/child-occupant-protection/",
        ),
        a_html(
            "Vulnerable Road Users",
            "https://www.euroncap.com/en/car-safety/the-ratings-explained/vulnerable-road-user-vru-protection/",
        ),
        a_html(
            "Safety Assist",
            "https://www.euroncap.com/en/car-safety/the-ratings-explained/safety-assist/",
        ),
    )
    for label, grp, grp_name in zip(labels, testing_groups, testing_group_names):
        gtbl = gtbl.tab_spanner(label, columns=[*grp, grp_name])
    return gtbl
add_tab_stubhead()add_tab_stubhead()使用了GT.tab_stubhead()來添加EURO NCAP的logo至分類標題。
def add_tab_stubhead(gtbl: GT) -> GT:
    img_src = "https://raw.githubusercontent.com/jrycw/posit-gt-2024/master/euroncap_logo/euroncap_pos.svg"
    return gtbl.tab_stubhead(html(f'<img src="{img_src}"/></br></br>'))
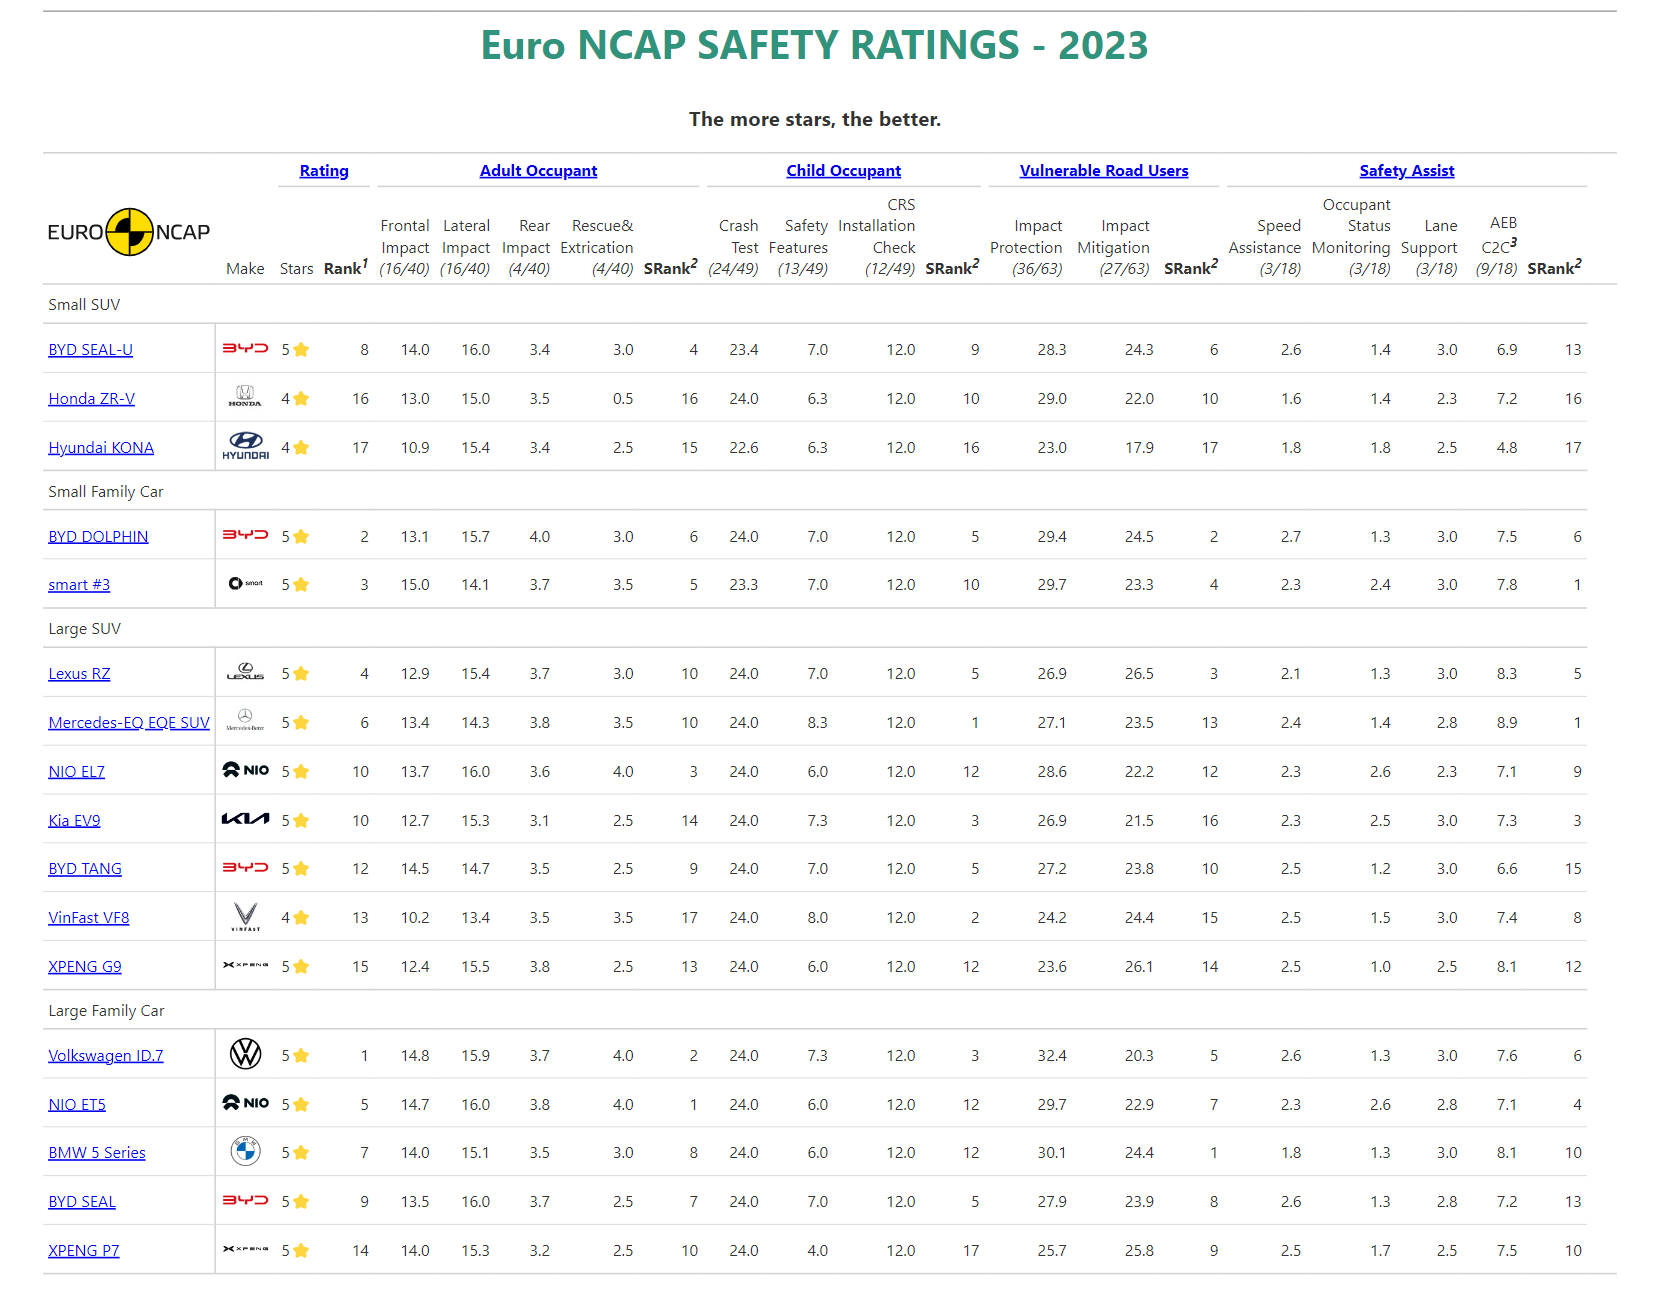
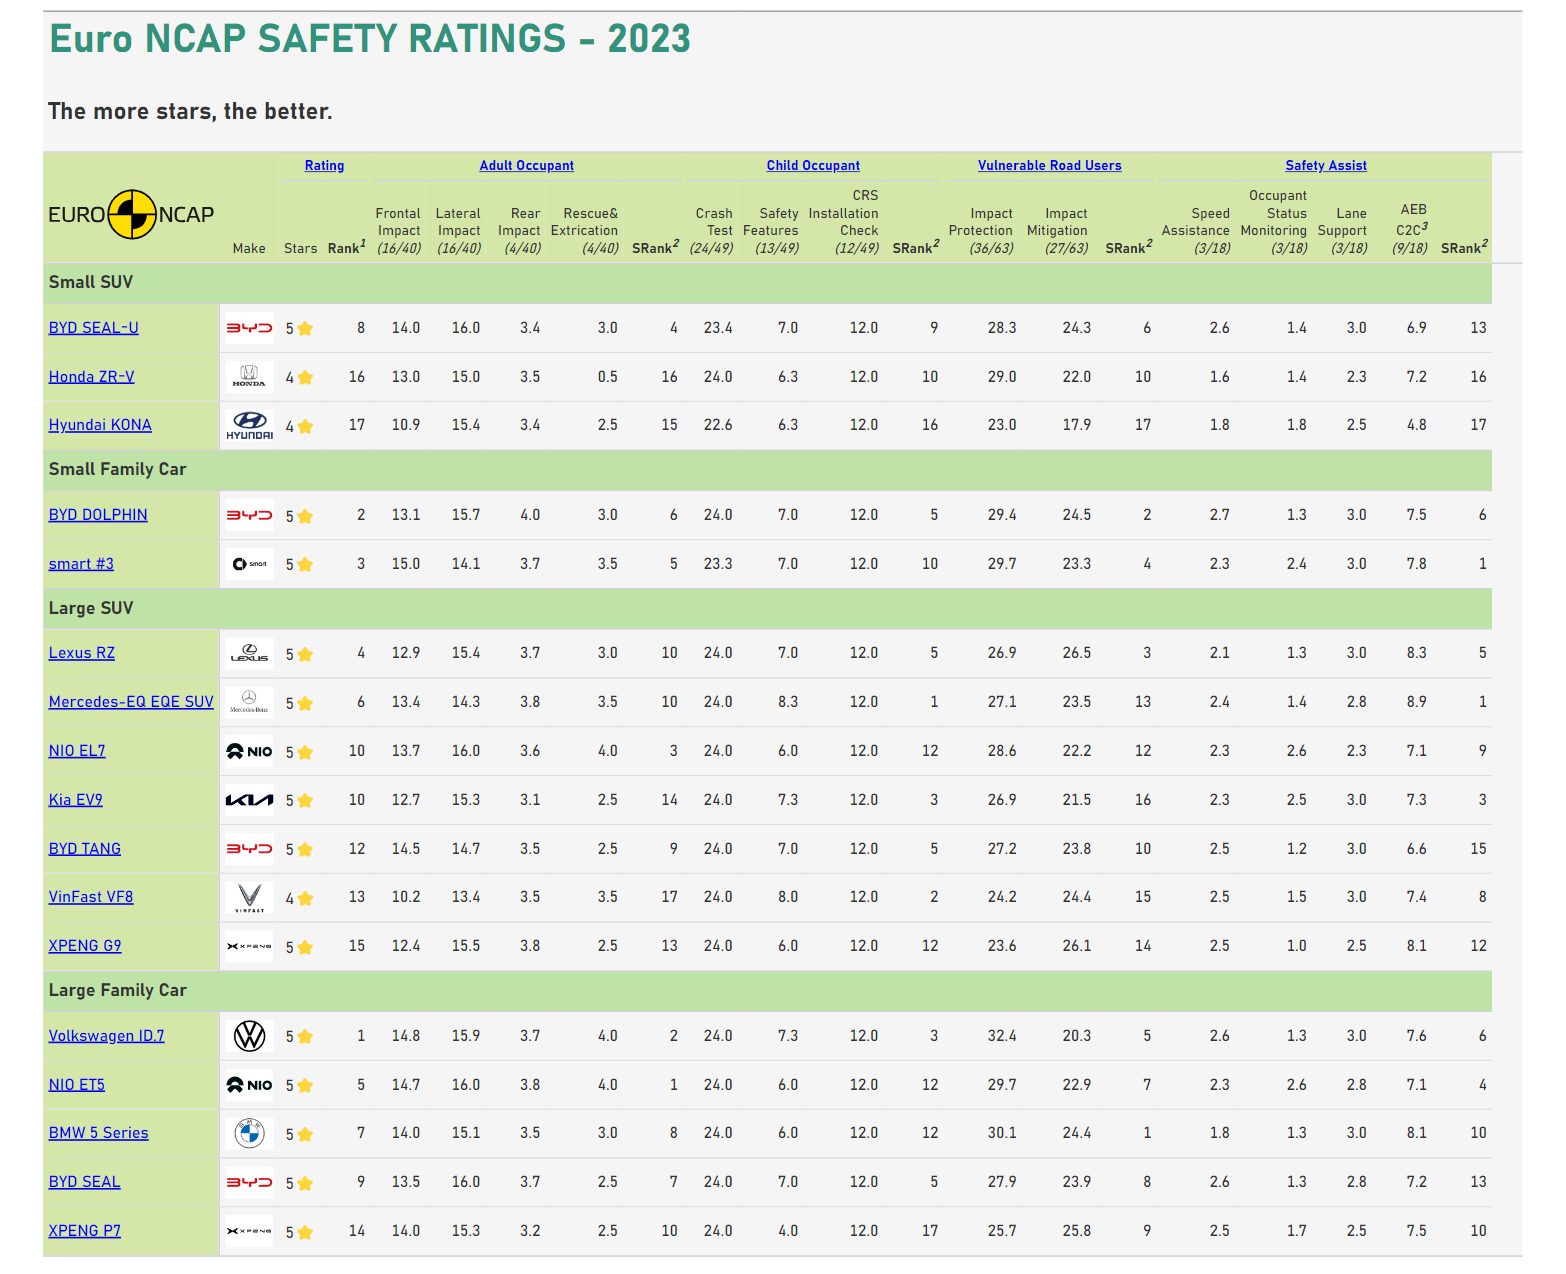
add_tab_option()add_tab_option()使用GT.tab_options()來客製化表格樣式。
def add_tab_option(gtbl: GT) -> GT:
    return gtbl.tab_options(
        stub_background_color=EuroNCAPPalette.STUB_COLUMN_LABEL.value,
        table_background_color=EuroNCAPPalette.TABLE_BACKGROUND.value,
        heading_align="left",
        heading_subtitle_font_size="16px",
        heading_subtitle_font_weight="bold",
        column_labels_font_size="14px",
        column_labels_background_color=EuroNCAPPalette.STUB_COLUMN_LABEL.value,
        row_group_font_size="18px",
        row_group_font_weight="bold",
        row_group_background_color=EuroNCAPPalette.ROW_GROUP.value,
        table_font_names=system_fonts("industrial"),
    )
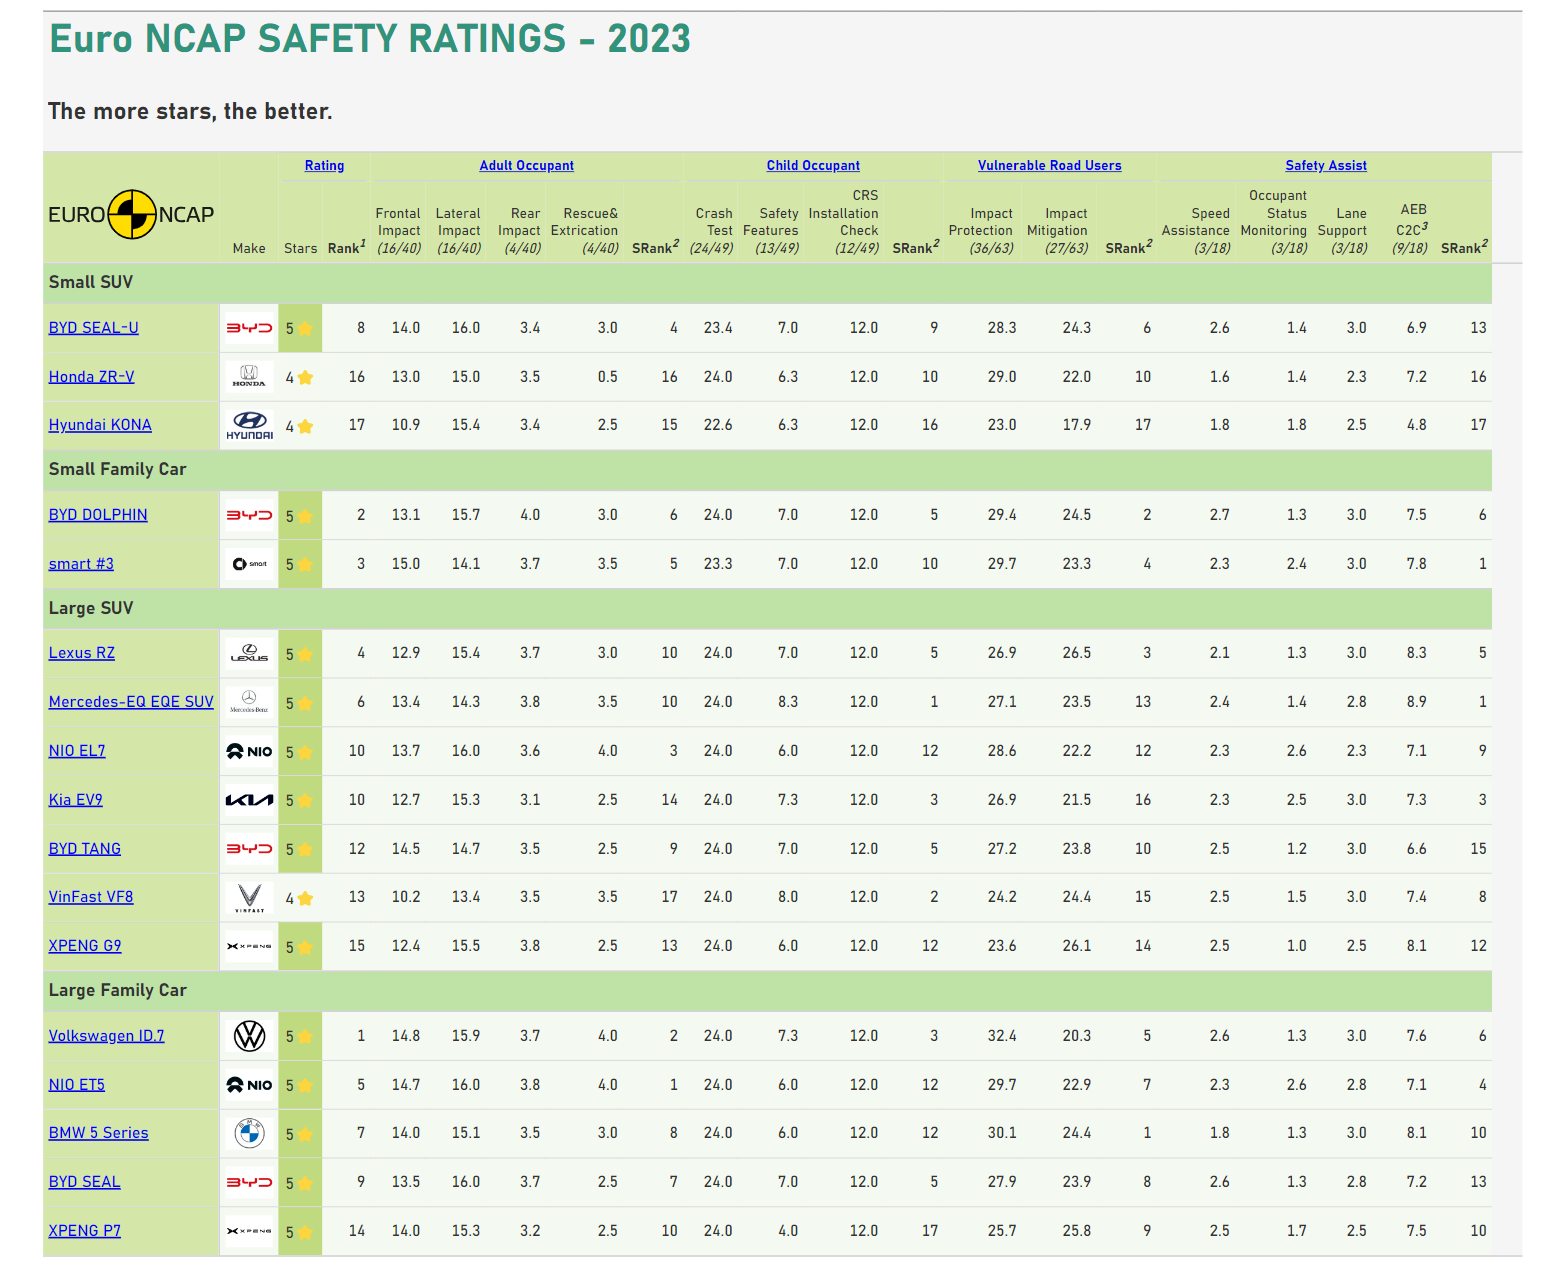
add_tab_style()add_tab_style()呼叫了兩次GT.tab_style()來調整表格樣式。第一次先將所有欄位的格子背景顏色調整為EuroNCAPPalette.CELL.value。第二次則將「"Stars"」欄位中,其行數為「"5⭐"」的格子背景顏色調整為EuroNCAPPalette.HIGHLIGHT1.value。
def add_tab_style(gtbl: GT) -> GT:
    return gtbl.tab_style(
        style=style.fill(color=EuroNCAPPalette.CELL.value),
        locations=loc.body(columns=cs.all()),
    ).tab_style(
        style=style.fill(color=EuroNCAPPalette.HIGHLIGHT1.value),
        locations=loc.body(columns="Stars", rows=pl.col("Stars").eq("5⭐")),
    )
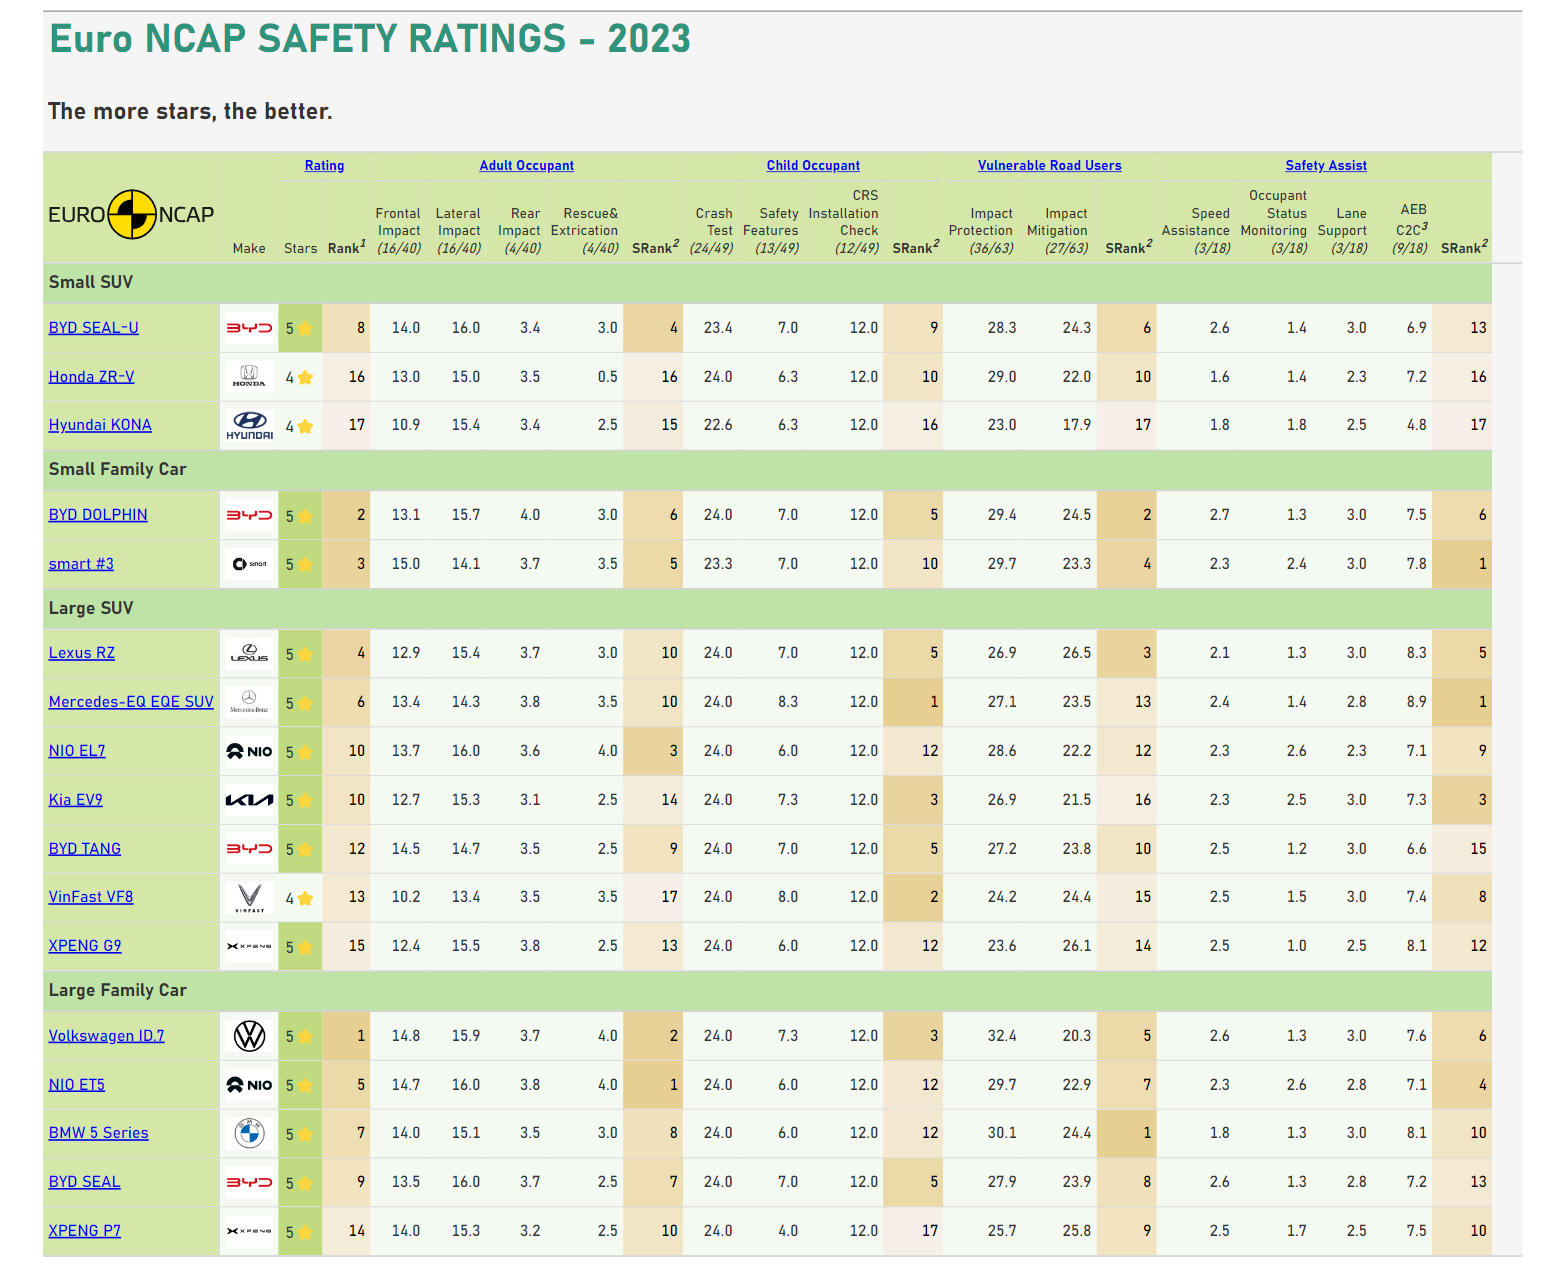
add_data_color()add_data_color()使用GT.data_color()來將各排序欄位變為漸層背景。
def add_data_color(gtbl: GT) -> GT:
    return gtbl.data_color(
        domain=[1, df.height],
        palette=[
            g.value
            for g in (
                EuroNCAPPalette.GRADIENT1,
                EuroNCAPPalette.GRADIENT2,
                EuroNCAPPalette.GRADIENT3,
            )
        ],
        columns=["Rank", *testing_group_names],
    )
add_tab_footnote()add_tab_footnote()多次呼叫GT.tab_source_note()來添加註解。
def add_tab_footnote(gtbl: GT) -> GT:
    return (
        gtbl.tab_source_note(
            html(
                "<i><sup>1 </sup></i>Rank is derived from the rank of the averaged ranks across the four categories."
            )
        )
        .tab_source_note(
            html(
                "<i><sup>2 </sup></i>SRank refers to ranking by the sum of each category."
            )
        )
        .tab_source_note(html("<i><sup>3 </sup></i>AEB C2C stands for AEB Car-to-Car."))
    )
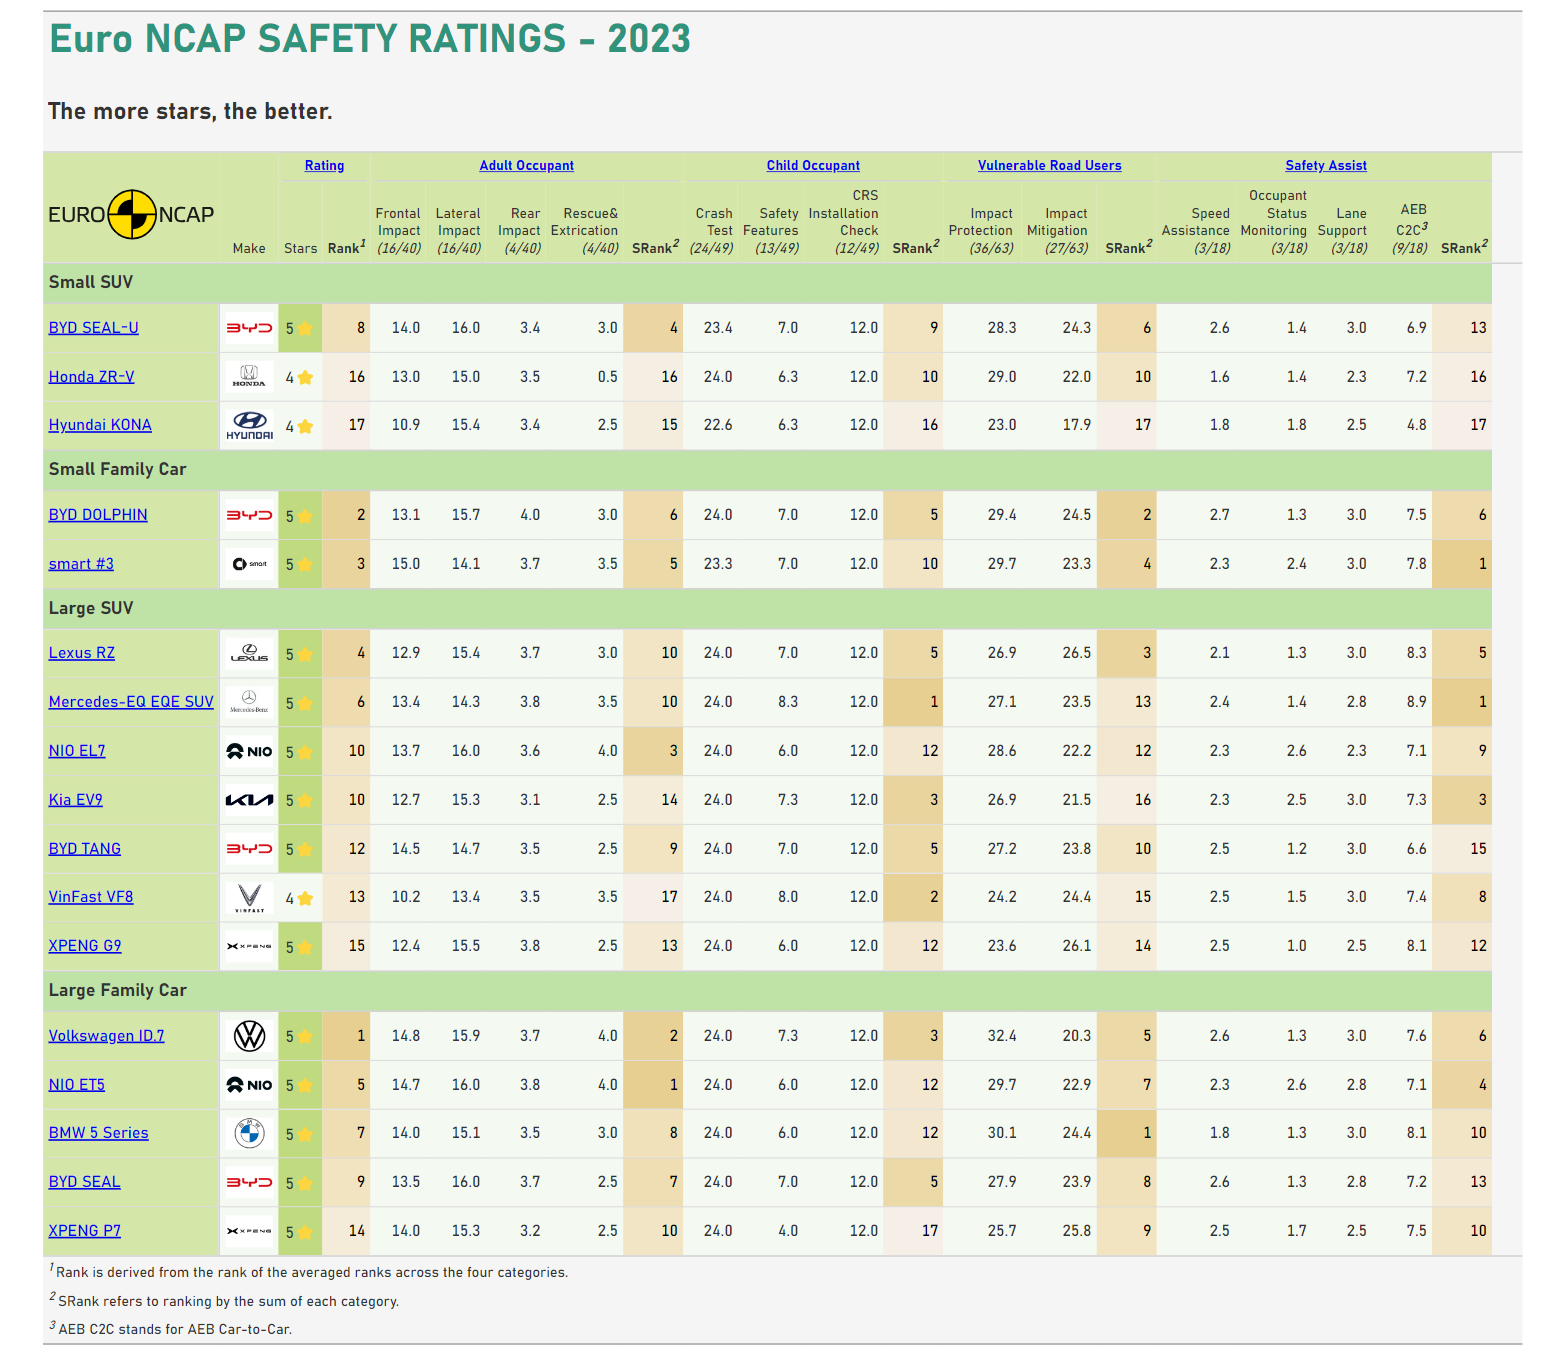
add_source_note()add_source_note()呼叫GT.tab_source_note()來添加資料來源。
def add_source_note(gtbl: GT) -> GT:
    source = 'Source: <a href="https://www.euroncap.com/en">Euro NCAP</a>'
    table = 'Table: <a href="https://cv.ycwu.space">Jerry Wu</a>'
    repo = 'Repo: <a href="https://github.com/jrycw/posit-gt-2024">posit-gt-2024</a>'
    return gtbl.tab_source_note(html(" | ".join([source, table, repo])))
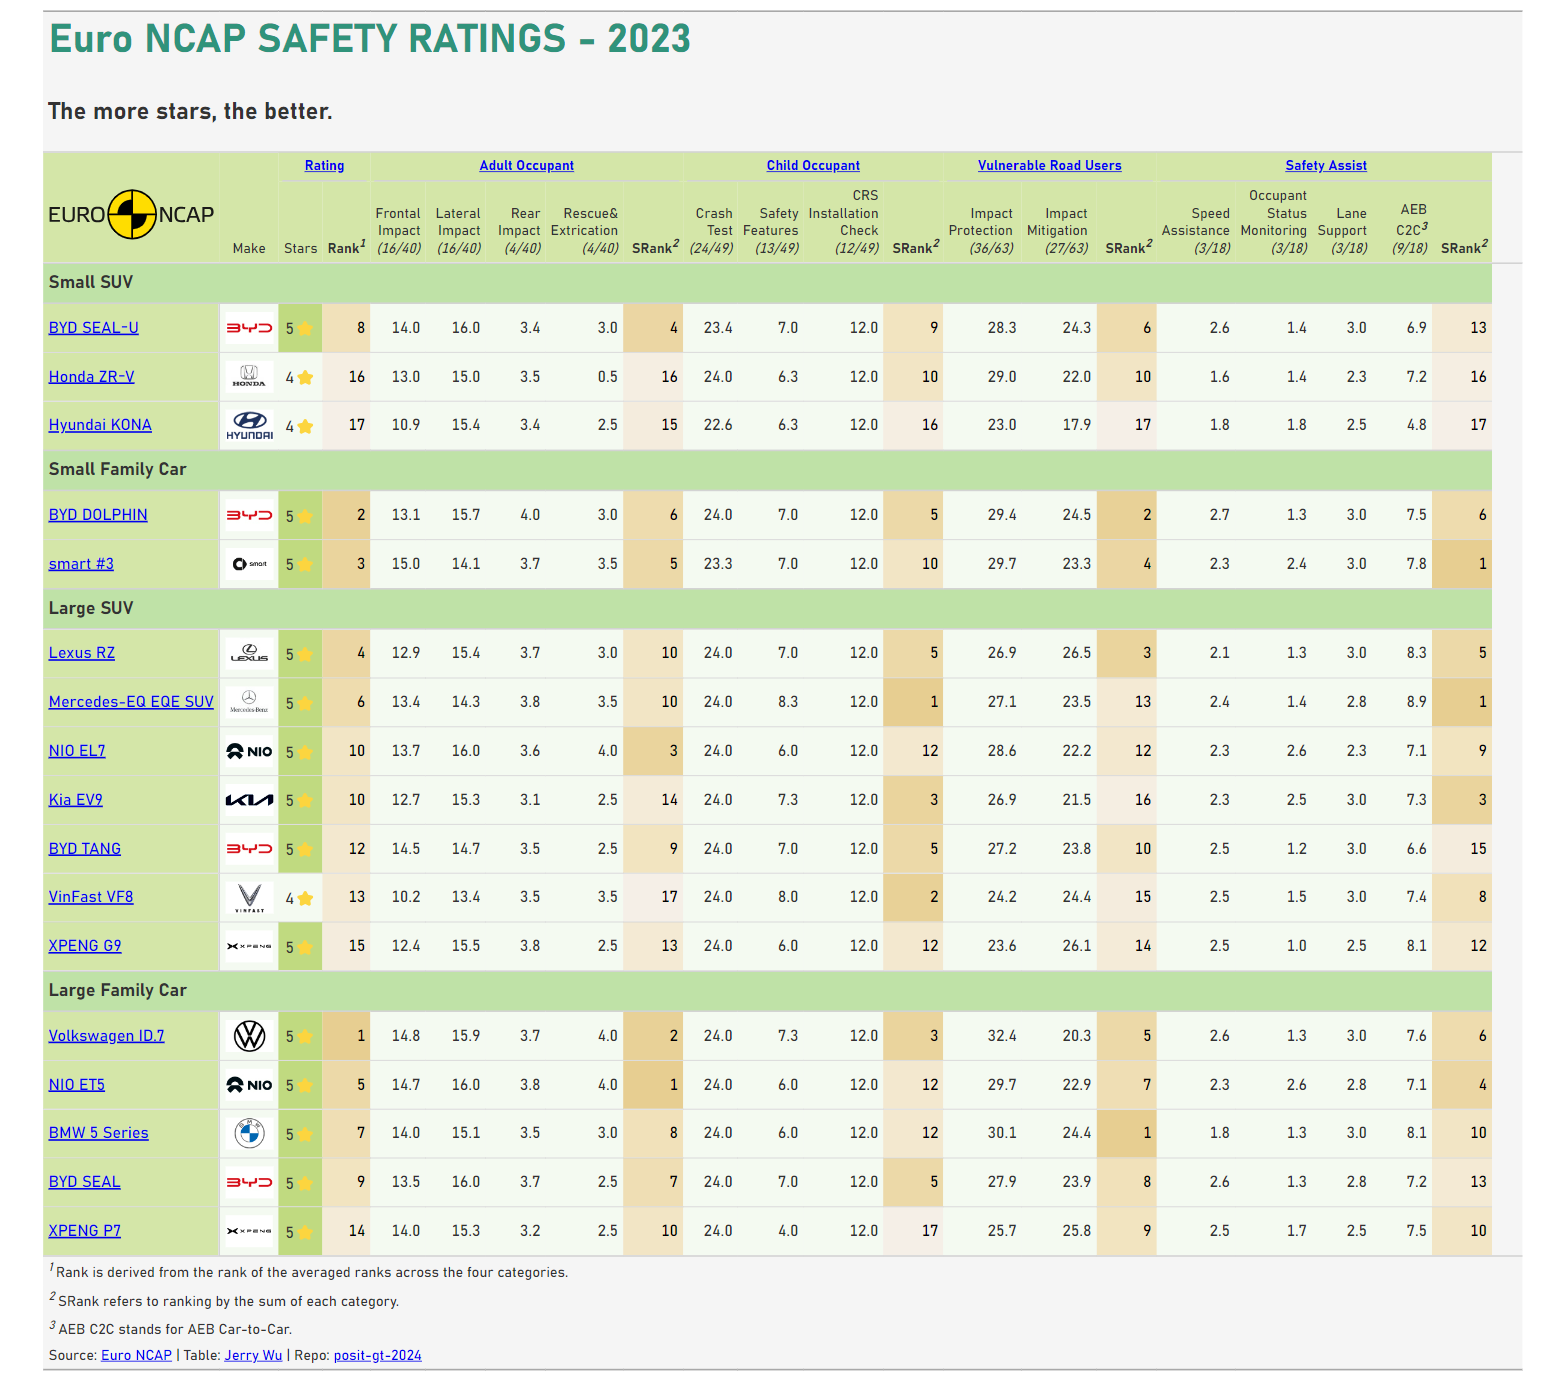
final_table()與make_table()一樣,我們只是想透過final_table()來存入預設的表格,所以直接返回所接收的GT instance,不做其它操作。
def final_table(gtbl: GT) -> GT:
    return gtbl
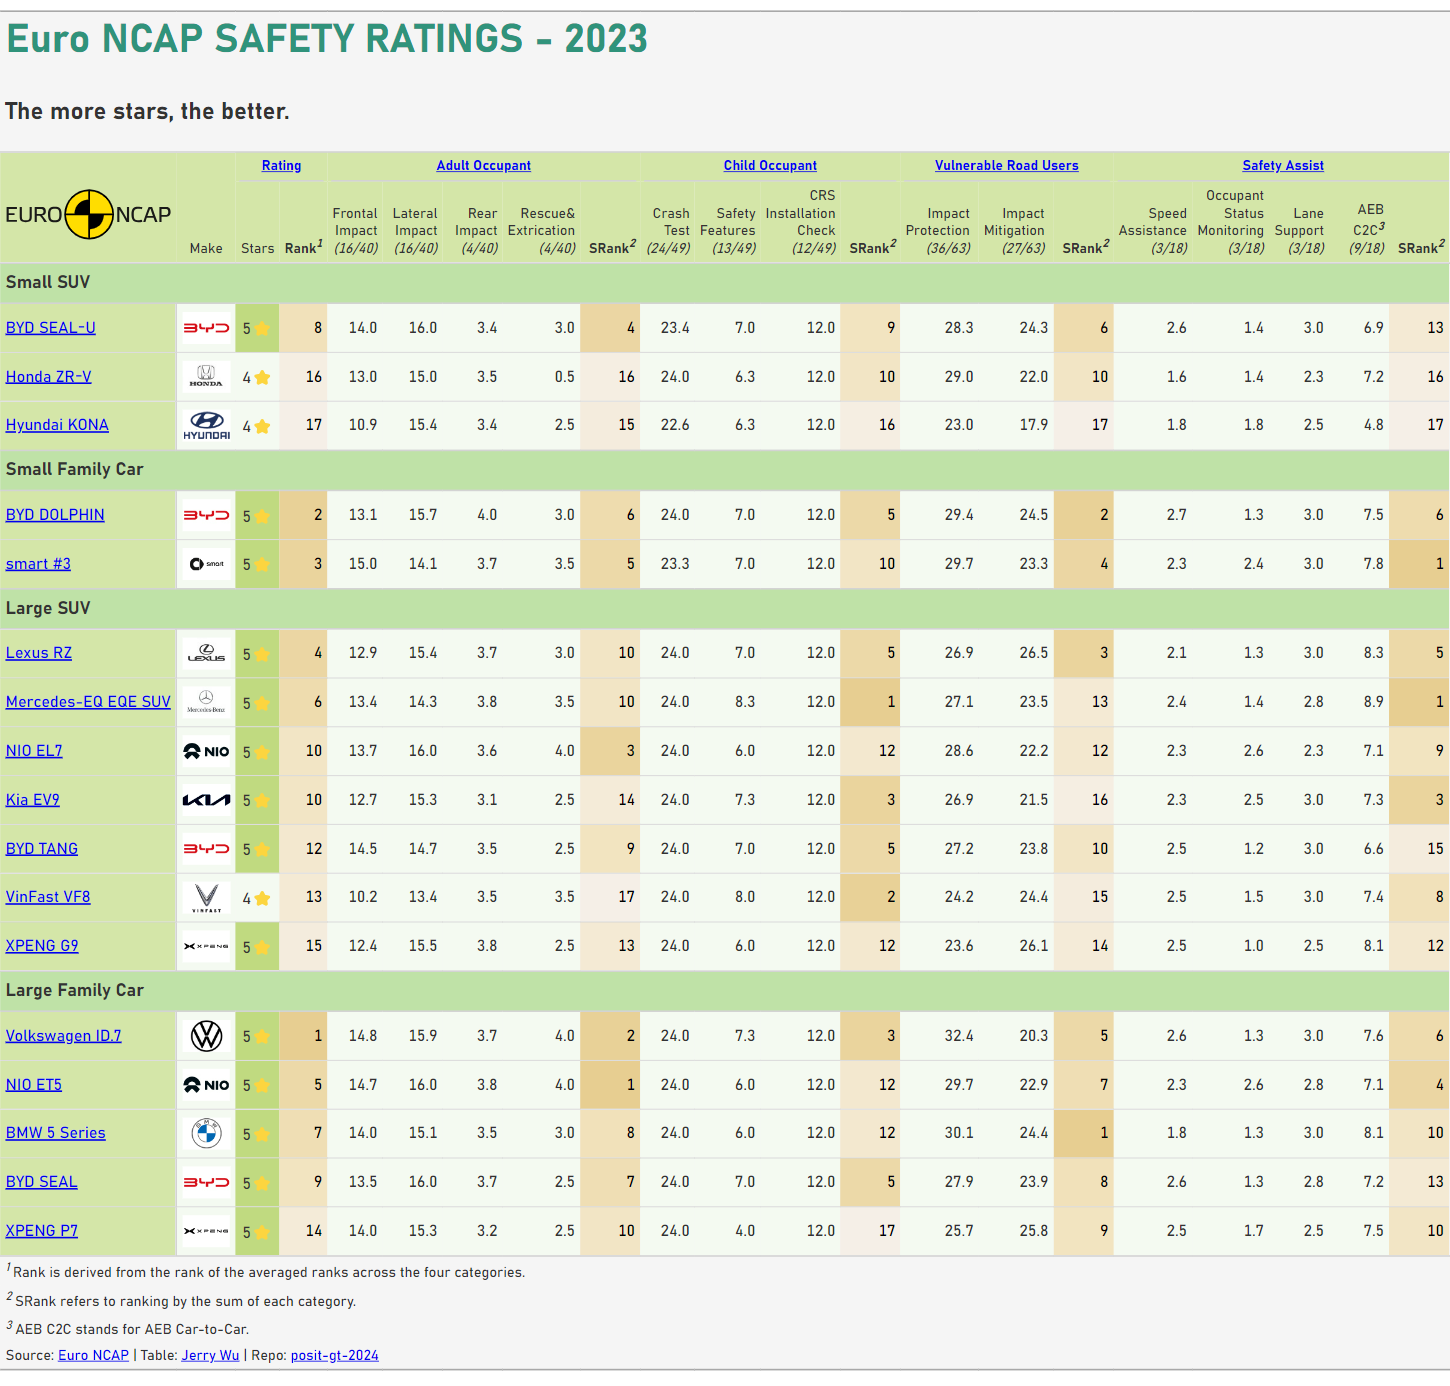
最後將所有函數收集至pipelines列表中,並呼叫make_table()來執行所有步驟。
pipelines = [
    default_table,
    grouping_table,
    add_formatter,
    adjust_cols,
    add_tab_header,
    add_tab_spanner,
    add_tab_stubhead,
    add_tab_option,
    add_tab_style,
    add_data_color,
    add_tab_footnote,
    add_source_note,
    final_table,
]

awesome_table = make_table(GT(df), pipelines, save_png=False)
