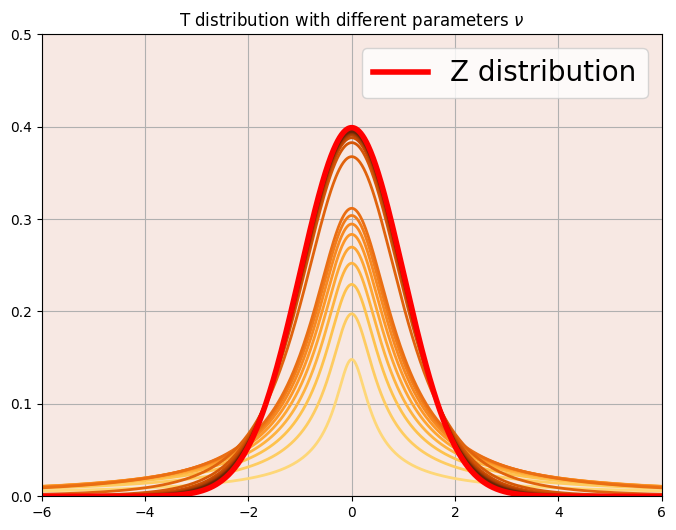
t 分配在 Python 的 PDF 程式碼為 t.pdf,其程式所使用的 PDF 如下,設定不同的參數值 $\nu$ ,如下圖,由下至上的橘色曲線為 $\nu = 0.1, 0.2, 0.3, \cdots, 1, \mbox{and}\ 3, 6, 9, \cdots, 30$ 的 t 分配;而紅色線為標準常態分布,也稱作 Z 分布。不論是 t 分布或標準常態分布,兩者皆對稱於 Y 軸。發現當 t 分布之參數 $\nu$ 越大,其 PDF 會從厚尾漸漸變成窄尾,且最大值上升。此外,在參數 $\nu$ 大到一個水準之後,t 分布之 PDF 形狀會 十分接近紅線的標準常態分布。

# t Distribution

from scipy.stats import t, norm


xlim = [-6, 6]
x_diff_t = np.linspace(xlim[0], xlim[1], 1000)

# df
df1 = np.arange(0.1, 1, 0.1)
df2 = np.arange(3, 30, 3)
c = np.concatenate([df1, df2], axis=0)
v = np.array(c)

# fix xlim before animation
gid, ax = plt.subplots(figsize=[8, 6])
ax.axis([xlim[0], xlim[1], 0, 0.5])

# color
col = plt.cm.YlOrBr(np.linspace(0.3, 1, len(v)))

for i in range(len(v)):
  y = t.pdf(x_diff_t, v[i])
  ax.plot(x_diff_t, y, color=col[i], lw=2)


# normal(0, 1)
y_sd_normal = norm.pdf(x_diff_t, 0, 1)
ax.plot(x_diff_t, y_sd_normal, label='Z distribution',\
        color='r' ,linewidth=4)
ax.legend(fontsize=20)
ax.grid(True)
ax.set_facecolor('#f7e8e3') # 背景色

ax.set_title(r'T distribution with different parameters $\nu$')

plt.show()

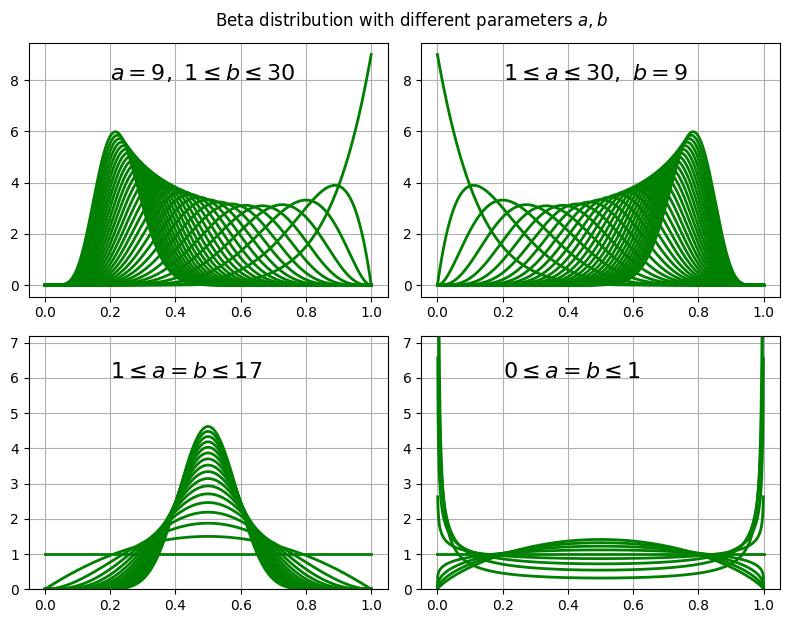
Beta 分配在 Python 的 PDF 程式碼為 `beta.pdf,其程式所使用的 PDF 如上式。設定不同的參數值 $a$ 與 $b$,如下圖,可以看出:
其中「峰度(Kurtosis)」與「偏度(Skewness)」的概念對一般人而言比較陌生,他們的解釋可以參考:

# Beta Distribution

from scipy.stats import beta

xlim = [0, 1]
x_diff_beta = np.linspace(xlim[0], xlim[1], 1000)

fig, ax = plt.subplots(2, 2, figsize=[8, 6])

# fig1
a0 = 9
b0 = np.arange(1, 31, 1)

for i in b0:
  y = beta.pdf(x_diff_beta, a0, i)
  ax[0][0].plot(x_diff_beta, y, linewidth=2, color='green')

ax[0][0].grid(True)
ax[0][0].text(0.2, 8, '$a = 9,\ 1 \leq b \leq 30$', fontsize=16)


# fig2
a1 = np.arange(1, 31, 1)
b1 = 9

for i in a1:
  y = beta.pdf(x_diff_beta, i, b1)
  ax[0][1].plot(x_diff_beta, y, linewidth=2, color='green')

ax[0][1].grid(True)
ax[0][1].text(0.2, 8, '$1 \leq a \leq 30,\ b = 9$', fontsize=16)


# fig3
a2 = np.arange(1, 18, 1)
b2 = np.arange(1, 18, 1)


for i in a2:
  y = beta.pdf(x_diff_beta, i, i)
  ax[1][0].plot(x_diff_beta, y, linewidth=2, color='green')

ax[1][0].set_ylim(0, 7+0.2)
ax[1][0].set_yticks(np.arange(0, 8, 1))
ax[1][0].grid(True)
ax[1][0].text(0.2, 6, '$1 \leq a = b \leq 17$', fontsize=16)

# fig4
a3 = np.arange(0, 2, 0.2)

for i in a3:
  y = beta.pdf(x_diff_beta, i, i)
  ax[1][1].plot(x_diff_beta, y, linewidth=2, color='green')

ax[1][1].set_yticks(np.arange(0, 8, 1))
ax[1][1].set_ylim(0, 7+0.2)
ax[1][1].grid(True)
ax[1][1].text(0.2, 6, '$0 \leq a = b \leq 1$', fontsize=16)

fig.tight_layout() # 縮減子圖間距

fig.suptitle(r'Beta distribution with different parameters $a, b$', \
             x=0.52, y=1.03)

plt.show()
