昨天已經透過 dbt 將資料轉換並存到 Postgres DB,那我們後續該如何確認資料內容呢?有兩種方式,GUI 和 CLI 工具,一起看下去吧!
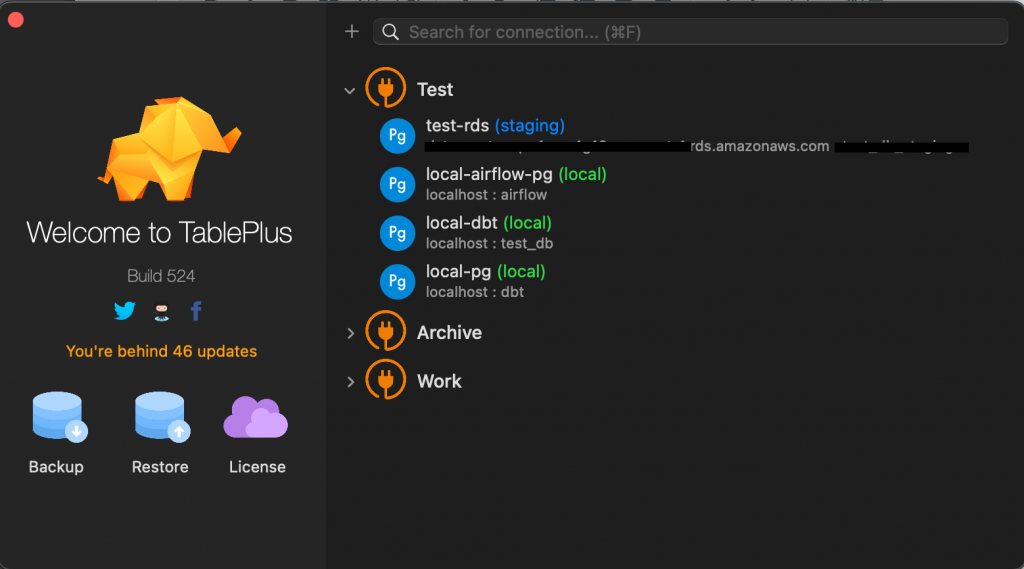
工作上為求方便,有些公司會購入不同的資料庫 GUI (圖形化介面)管理工具,方便團隊成員快速查看資料,我用過的有三款:Beekeeper Studio、TablePlus、DBeaver,每一款都有提供免費版和付費版,免費版都會有一些限制,但整體用下來 TablePlus 不管事支援的資料庫和易用性上都大幅贏過其他工具,但是免費版的 TablePlus 一次只能開 2 個分頁真的會很痛苦,所以如果個人或公司願意花錢,最推薦 TablePlus,想要免費的話可以從 Beekeeper Studio(簡潔但支援DB類型較少)、DBeaver(複雜但支援DB類型較多) 中挑選。
黃色區塊 是資料或是欄位結構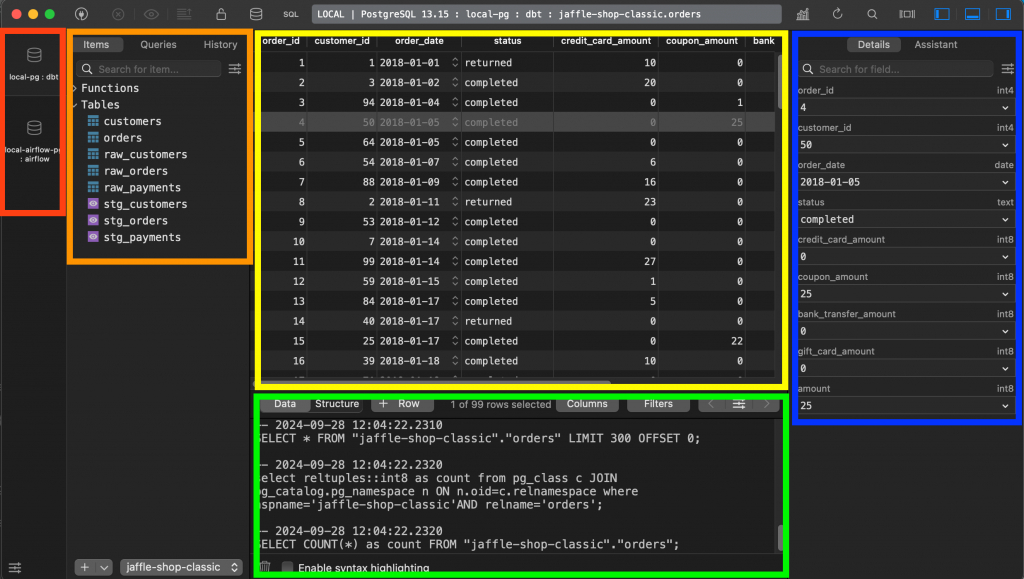
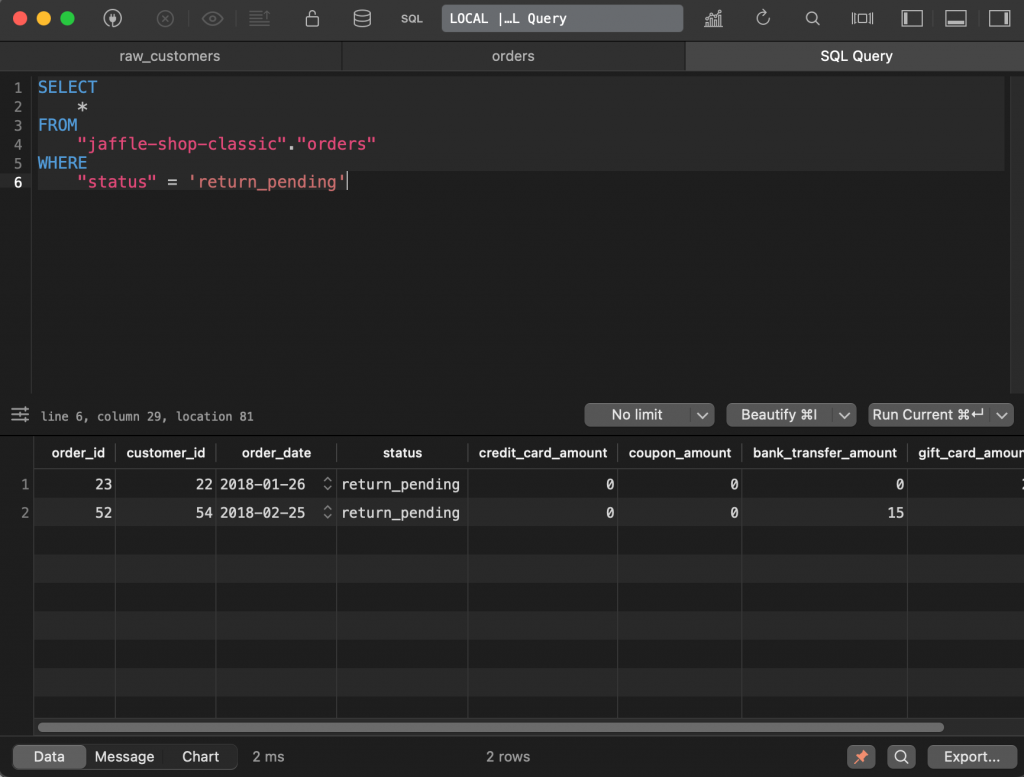
可以看到右上方可以開關左/下/右的區塊,就能讓你更專注查看目前的資料,也可以透過上方頁籤切換不同的表來查看,篩選的功能也是很方便,就不用去下 sql 來查資料,當然也能開啟 SQL 頁籤來直接用語法查詢。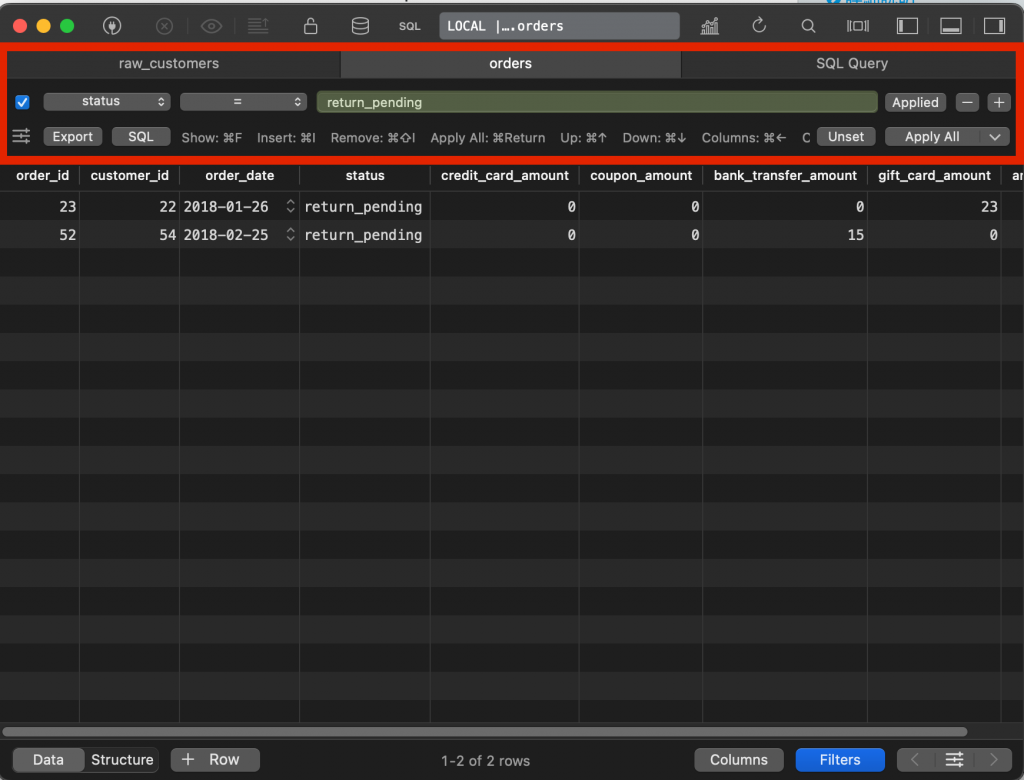
直接在首頁按加號,選擇 PostgreSQL 類型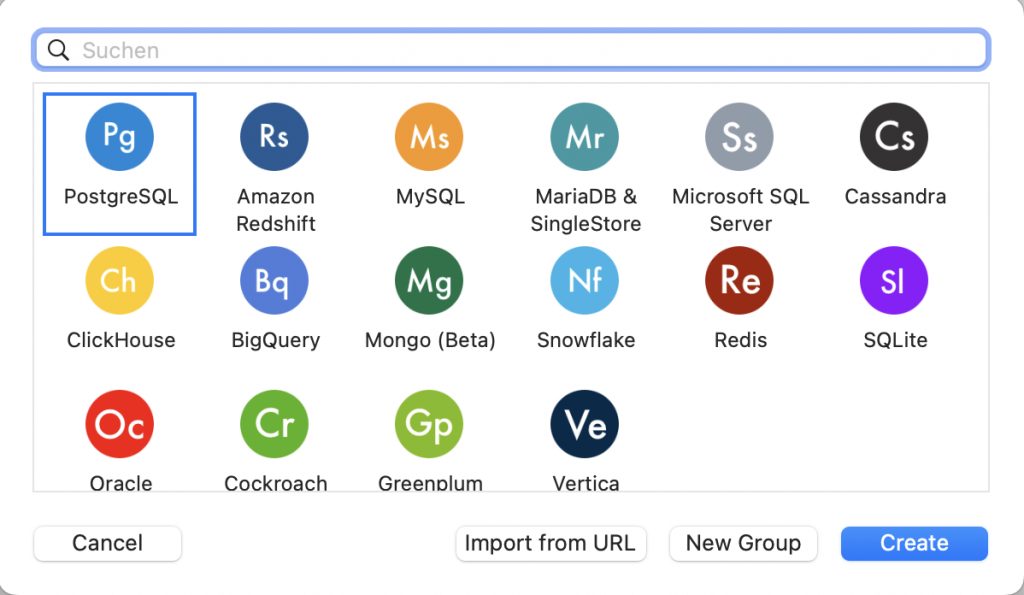
輸入連接資訊:user/database/password 都是 dbt、host 是 localhost,其他就能自行命名(連接名稱和tag)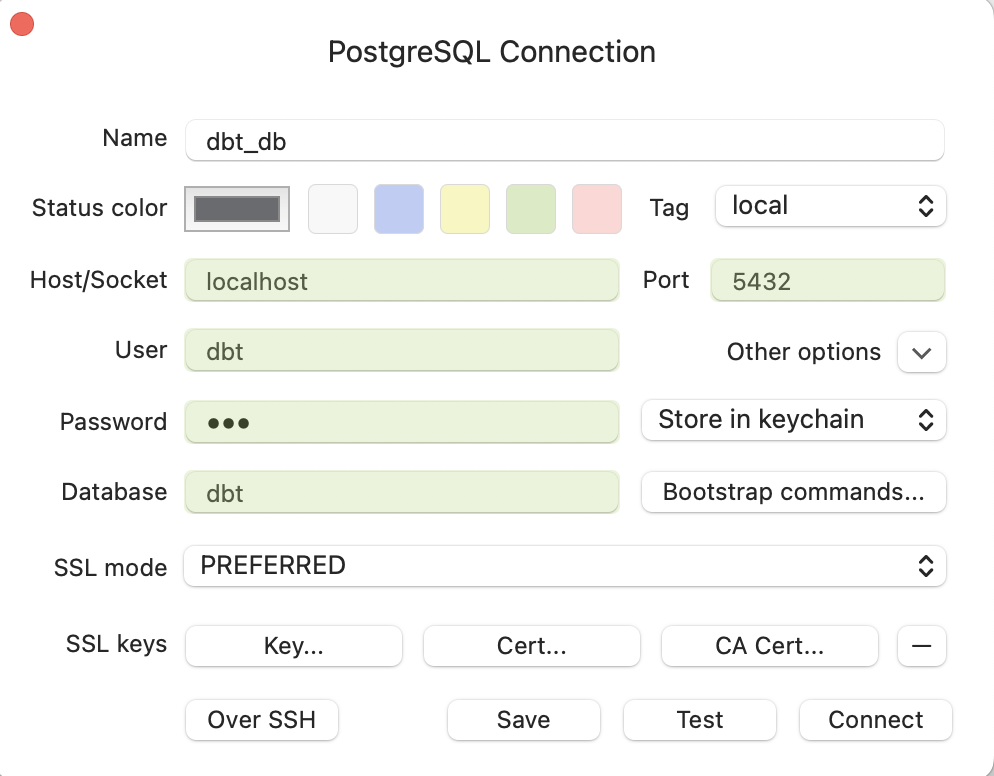
psqlpostgresql
brew install postgresql
psql -h localhost -p 5432 -U dbt -d dbt
接著輸入密碼:dbt 就可以連接到從 docker 開起的 postgres db 了
=。-d dbname # --dbname=dbname
-h host # --host=host
-p 5432 # --port=port
-U username # --username=username
-w # --no-password
-W # --password
jaffle-shop-classic
jaffle_shop:
  target: dev
  outputs:
    dev:
      type: postgres
      host: localhost
      user: dbt
      password: dbt
      port: 5432
      dbname: dbt
      schema: jaffle-shop-classic
      threads: 4
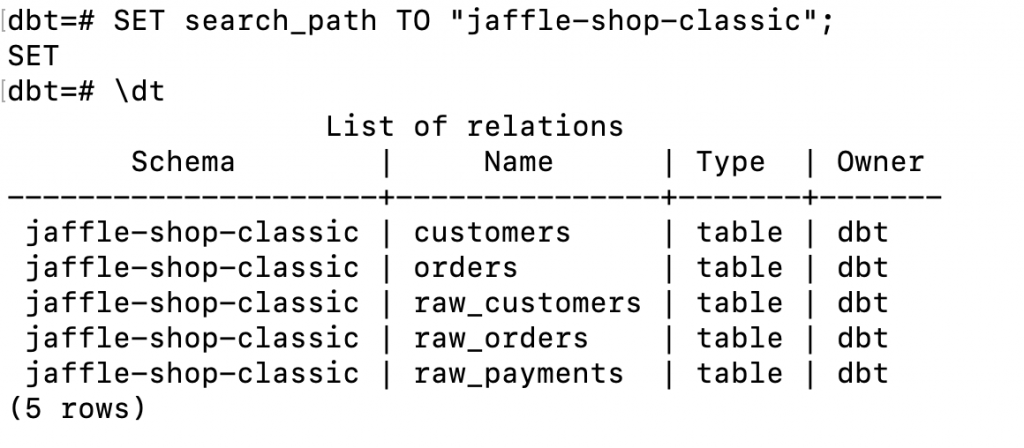
SET search_path TO "jaffle-shop-classic";
\! clear : 清除視窗\l : 列出所有的資料庫\dn : 列出所有的 schema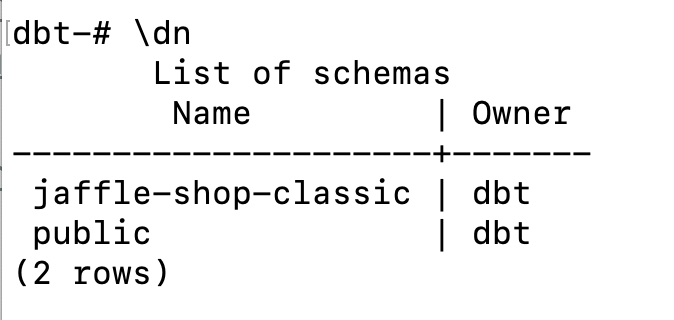
\dt : 列出特定 public schema 當中的 table 和 view\dt {schema_name}.* : 列出特定 schema 當中的 table 和 view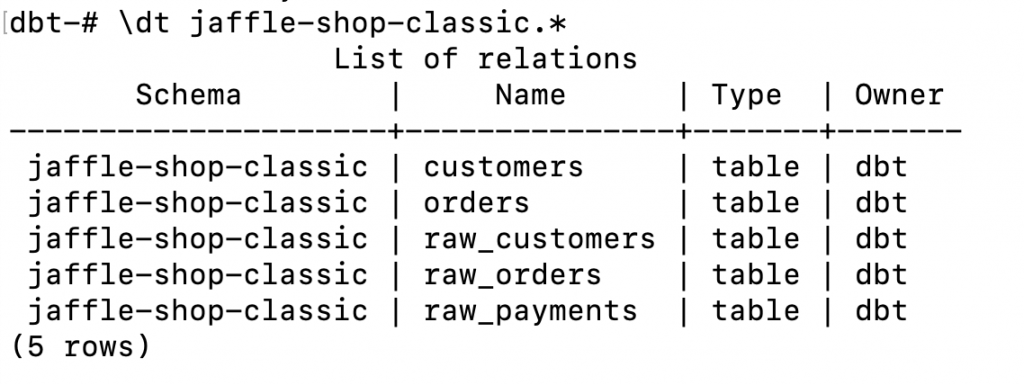
- 忘記資料存在哪個 schema,也可以直接下
\dt *.*來查看所有 schema 的 table 和 view- 如果有像上一步設定完 schema,就可以直接用
\dt查詢到所在 schema 下的內容
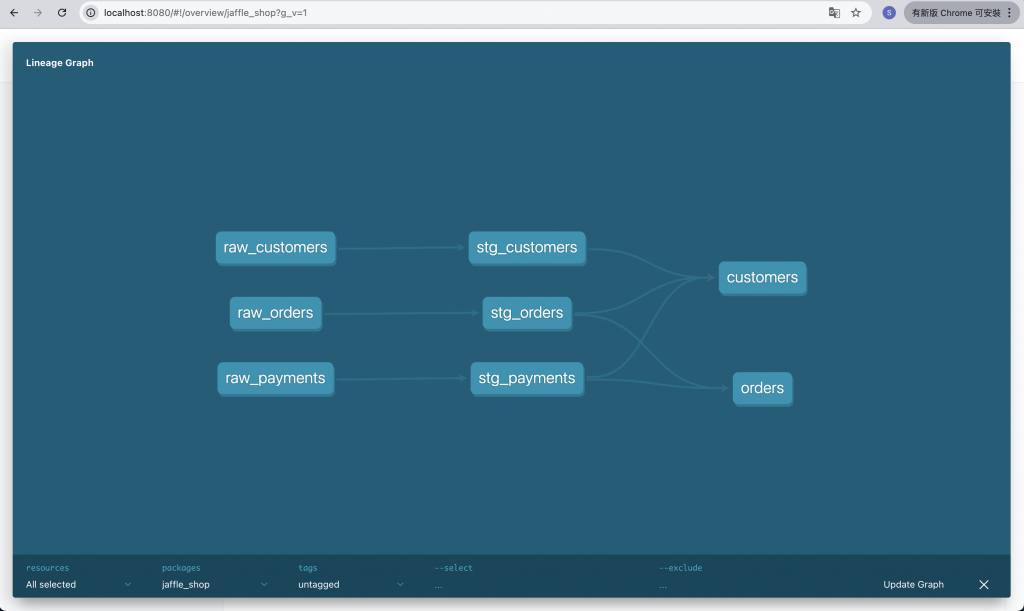
用 dbt docs 確認各表的關係,以 orders 表為例,從 stg_orders 和 stg_payments 轉換而成,基本上會確認筆數、金額、欄位格式,最後就會抽特定的 customer_id 來去確認細節。
確認轉換前後資料筆數一致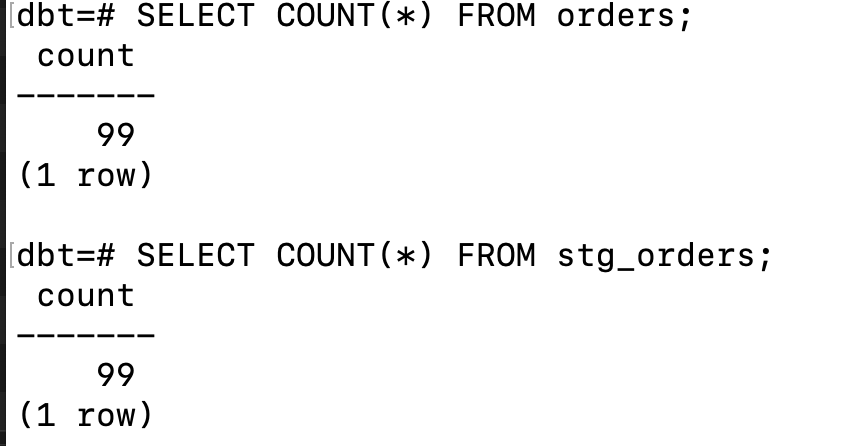
確認轉換前後訂單總金額一致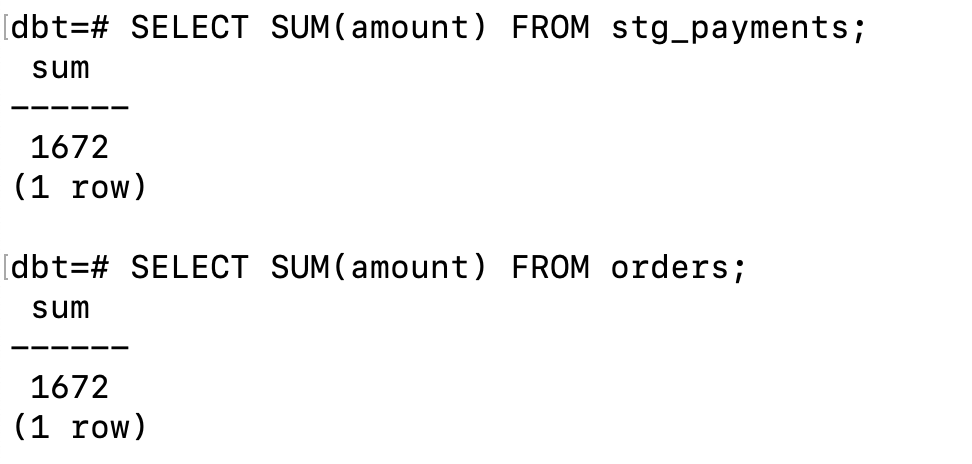
檢查欄位轉換格式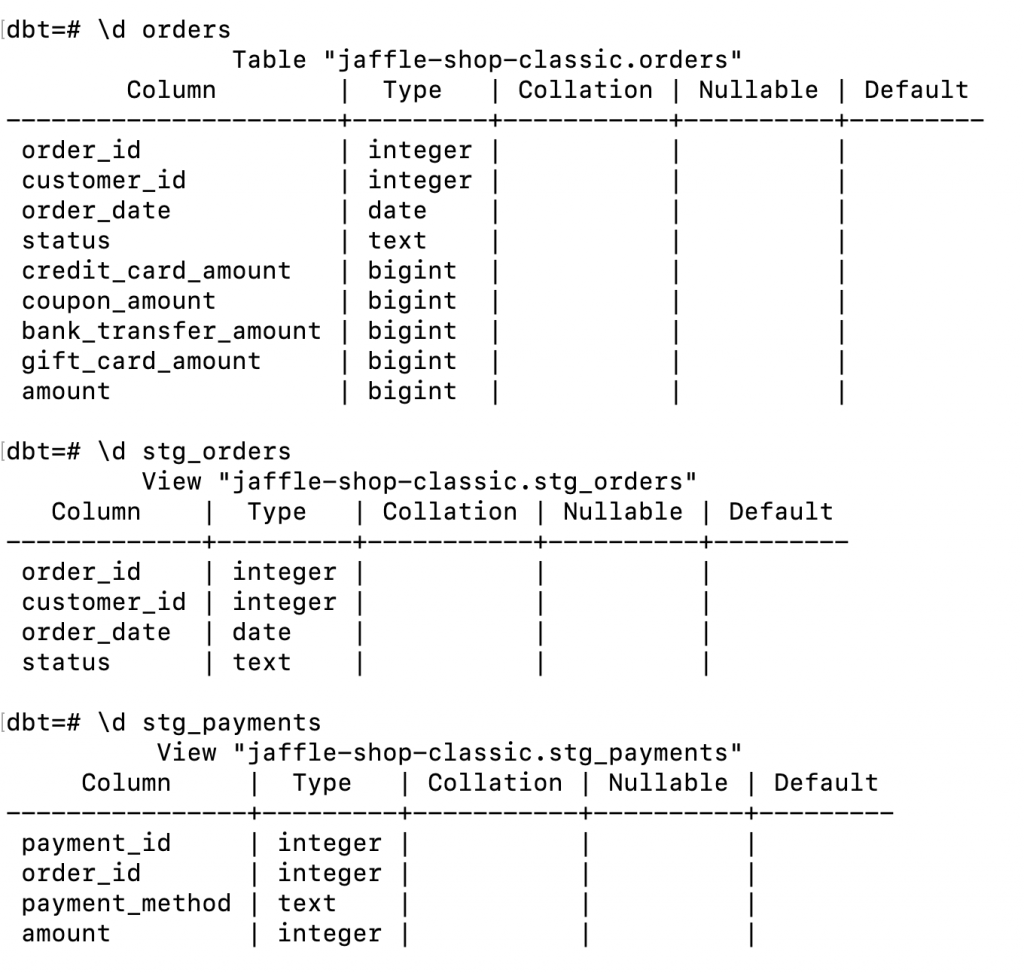
如果可以還是用 GUI 確認會方便很多,但這都是在本地開發時手動確認的部分,如果是運行中的 pipeline,且有固定要檢查的規則,通常還是會用 dbt test 或是其它資料工具來確認資料品質,後續講完 astronomer-cosmos 後,就會分享一些檢查資料品質的工具,例如很紅的 Great Expectation。