程式環境都會用colab 來執行程式,如果要在其他環境執行,請自行修改哦
colab 事前準備:設定專案和 API 金鑰
載入gemini
#pip install -q -U google-generativeai
import google.generativeai as genai
API 金鑰
from google.colab import userdata
API_KEY=userdata.get('GOOGLE_API_KEY')

#genai.configure(api_key="YOUR_API_KEY")

# Configure the client library by providing your API key.
genai.configure(api_key=API_KEY)
import re
import tqdm
import numpy as np
import pandas as pd
import matplotlib.pyplot as plt
import seaborn as sns


from sklearn.datasets import fetch_20newsgroups
from sklearn.manifold import TSNE
列出有支援的嵌入model
for m in genai.list_models():
  if 'embedContent' in m.supported_generation_methods:
    print(m.name)
回答
models/embedding-001
models/text-embedding-004
20 Newsgroups Text Dataset 包含 20 個主題的 18,000 個新聞群組貼文,分為訓練和測試集。
newsgroups_train = fetch_20newsgroups(subset='train')

# View list of class names for dataset
newsgroups_train.target_names
回答
['alt.atheism',
 'comp.graphics',
 'comp.os.ms-windows.misc',
 'comp.sys.ibm.pc.hardware',
 'comp.sys.mac.hardware',
 'comp.windows.x',
 'misc.forsale',
 'rec.autos',
 'rec.motorcycles',
 'rec.sport.baseball',
 'rec.sport.hockey',
 'sci.crypt',
 'sci.electronics',
 'sci.med',
 'sci.space',
 'soc.religion.christian',
 'talk.politics.guns',
 'talk.politics.mideast',
 'talk.politics.misc',
 'talk.religion.misc']
idx = newsgroups_train.data[0].index('Lines')
print(newsgroups_train.data[0][idx:])
回答
Lines: 15

 I was wondering if anyone out there could enlighten me on this car I saw
the other day. It was a 2-door sports car, looked to be from the late 60s/
early 70s. It was called a Bricklin. The doors were really small. In addition,
the front bumper was separate from the rest of the body. This is
all I know. If anyone can tellme a model name, engine specs, years
of production, where this car is made, history, or whatever info you
have on this funky looking car, please e-mail.

Thanks,
- IL
   ---- brought to you by your neighborhood Lerxst ----
# 應用程式從 newsgroups.data 的資料點中刪除姓名、電子郵件和無關單字

newsgroups_train.data = [re.sub(r'[\w\.-]+@[\w\.-]+', '', d) for d in newsgroups_train.data] # Remove email
newsgroups_train.data = [re.sub(r"\([^()]*\)", "", d) for d in newsgroups_train.data] # Remove names
newsgroups_train.data = [d.replace("From: ", "") for d in newsgroups_train.data] # Remove "From: "
newsgroups_train.data = [d.replace("\nSubject: ", "") for d in newsgroups_train.data] # Remove "\nSubject: "

# 在 5,000 個字元後截斷每個文字條目
newsgroups_train.data = [d[0:5000] if len(d) > 5000 else d for d in newsgroups_train.data]
# 將訓練點放入資料框中
df_train = pd.DataFrame(newsgroups_train.data, columns=['Text'])
df_train['Label'] = newsgroups_train.target
# 將標籤與目標名稱索引相符
df_train['Class Name'] = df_train['Label'].map(newsgroups_train.target_names.__getitem__)

df_train
回答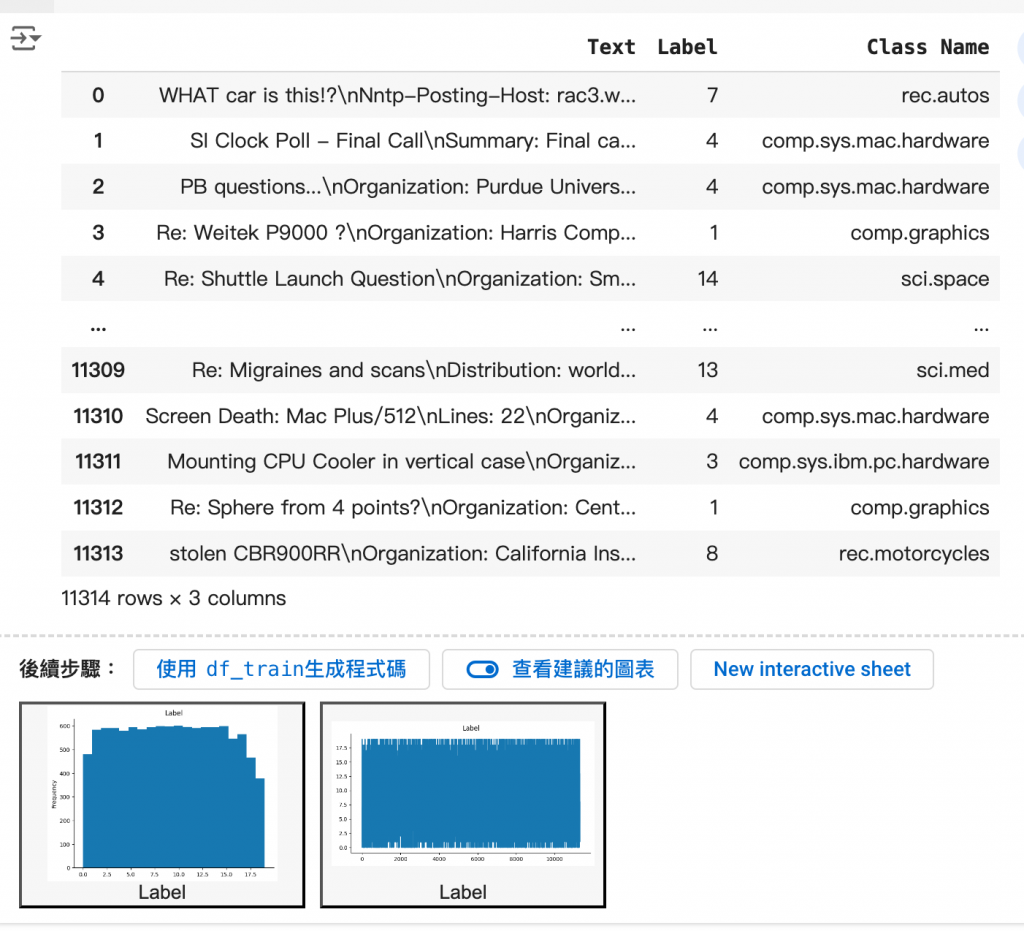
# 從 df_train 中抽取每個標籤類別的樣本
SAMPLE_SIZE = 150
df_train = (df_train.groupby('Label', as_index = False)
                    .apply(lambda x: x.sample(SAMPLE_SIZE))
                    .reset_index(drop=True))

# 選擇有關科學的類別
df_train = df_train[df_train['Class Name'].str.contains('sci')]

# 重置索引
df_train = df_train.reset_index()
df_train
回答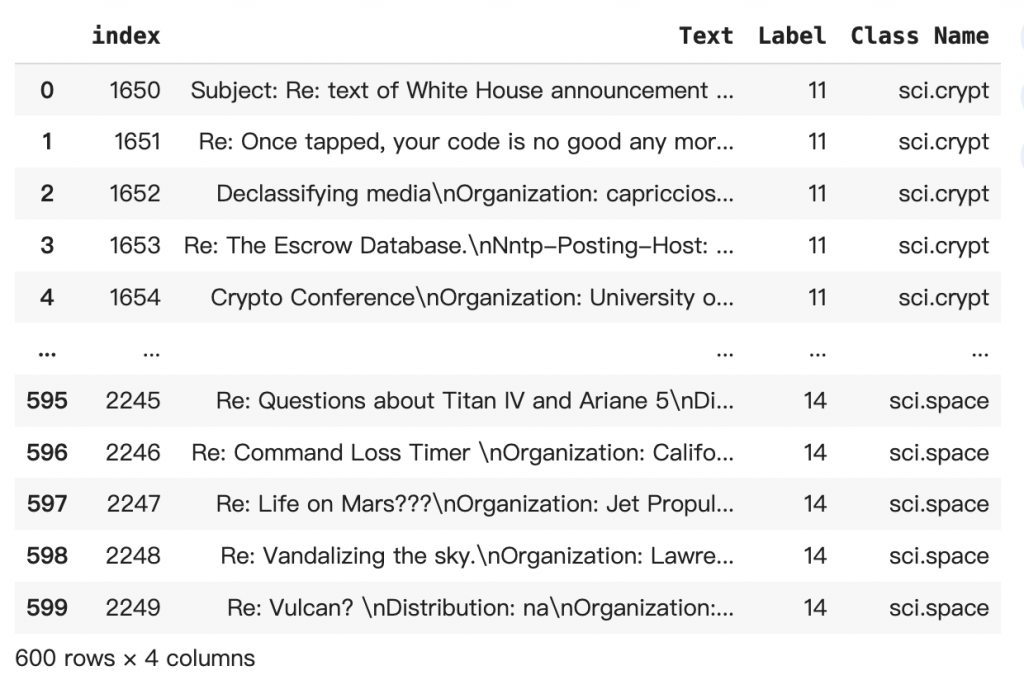
df_train['Class Name'].value_counts()
回答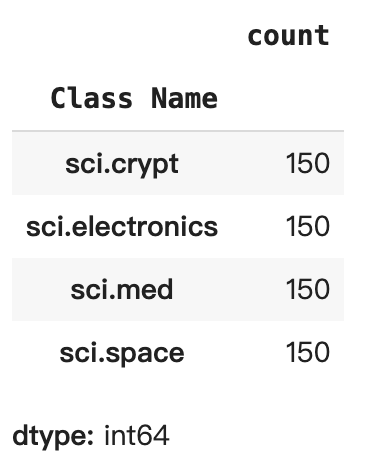
將 API 變更為使用模型嵌入功能 001 的嵌入 新的嵌入模型「embedding-001」其中有新的工作類型參數和選用標題 (僅適用於 task_type=RETRIEVAL_DOCUMENT)。
這些新參數僅適用於最新的嵌入模型。工作類型如下:
工作類型
from tqdm.auto import tqdm
tqdm.pandas()

from google.api_core import retry

def make_embed_text_fn(model):

  @retry.Retry(timeout=300.0)
  def embed_fn(text: str) -> list[float]:
    # Set the task_type to CLUSTERING.
    embedding = genai.embed_content(model=model,
                                    content=text,
                                    task_type="clustering")['embedding']
    return np.array(embedding)

  return embed_fn

def create_embeddings(df):
  model = 'models/embedding-001'
  df['Embeddings'] = df['Text'].progress_apply(make_embed_text_fn(model))
  return df

df_train = create_embeddings(df_train)
df_train.drop('index', axis=1, inplace=True)
文件嵌入向量的維度為 768。為了視覺化呈現內嵌文件的分組方式,您必須套用維度縮減功能,因為您只能在 2D 或 3D 空間中視覺化嵌入嵌入。
len(df_train['Embeddings'][0])
回答
768
# Convert df_train['Embeddings'] Pandas series to a np.array of float32
X = np.array(df_train['Embeddings'].to_list(), dtype=np.float32)
X.shape
回答
(600, 768)
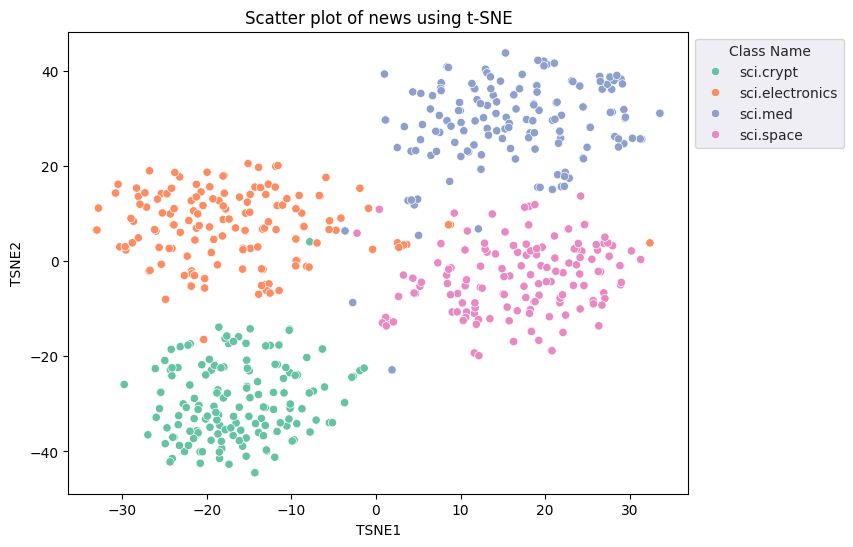
應用 t-DistributedStochastic Neighbor Embedding (t-SNE) 方法來縮減維度。這項技巧可以減少維度數量,同時保留叢集 (相近距離的資料點)。針對原始資料,模型會嘗試建構分佈,並與其他資料點「相鄰」(舉例來說,兩者的意義相近)。接著會最佳化目標函式,在圖表中保持類似的分佈。
tsne = TSNE(random_state=0, n_iter=1000)
tsne_results = tsne.fit_transform(X)
回答
/usr/local/lib/python3.10/dist-packages/sklearn/manifold/_t_sne.py:1162: FutureWarning: 'n_iter' was renamed to 'max_iter' in version 1.5 and will be removed in 1.7.
warnings.warn(
df_tsne = pd.DataFrame(tsne_results, columns=['TSNE1', 'TSNE2'])
df_tsne['Class Name'] = df_train['Class Name'] # Add labels column from df_train to df_tsne
df_tsne
回答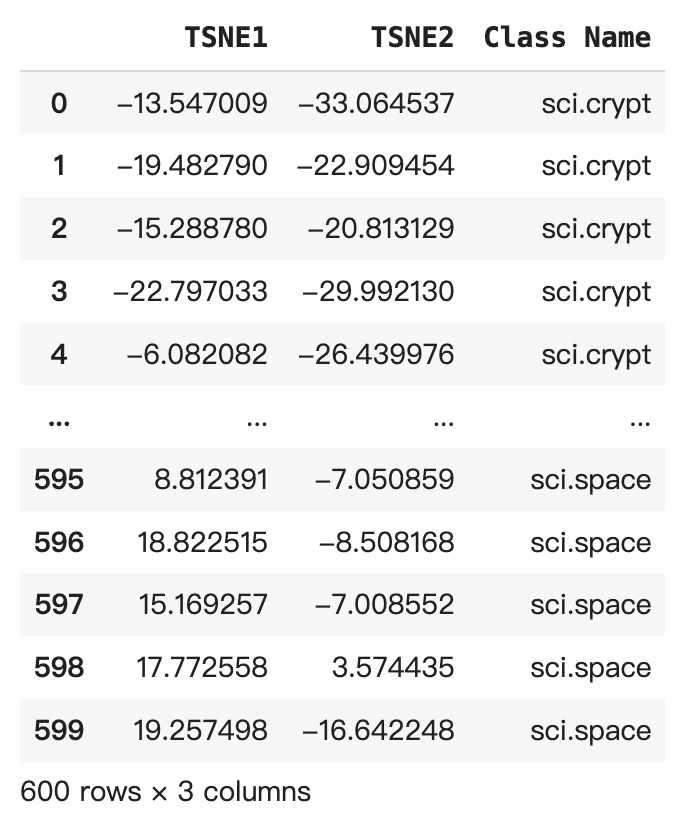
fig, ax = plt.subplots(figsize=(8,6)) # Set figsize
sns.set_style('darkgrid', {"grid.color": ".6", "grid.linestyle": ":"})
sns.scatterplot(data=df_tsne, x='TSNE1', y='TSNE2', hue='Class Name', palette='Set2')
sns.move_legend(ax, "upper left", bbox_to_anchor=(1, 1))
plt.title('Scatter plot of news using t-SNE')
plt.xlabel('TSNE1')
plt.ylabel('TSNE2');
回答
要判斷哪些點異常,請判斷哪些點是離群值和離群值。請先找出代表集群中心的質心或位置,然後使用距離判斷離群值的點。
def get_centroids(df_tsne):
  # Get the centroid of each cluster
  centroids = df_tsne.groupby('Class Name').mean()
  return centroids

centroids = get_centroids(df_tsne)
centroids
回答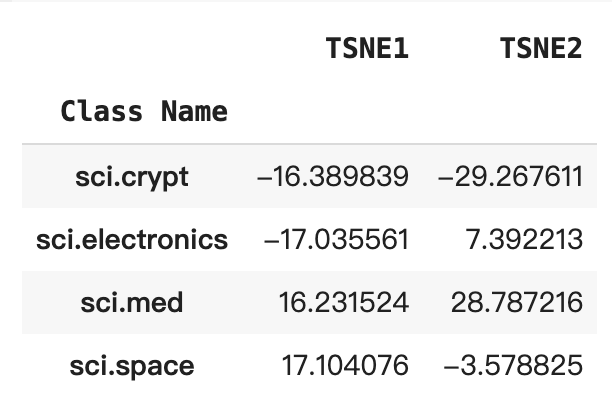
def get_embedding_centroids(df):
  emb_centroids = dict()
  grouped = df.groupby('Class Name')
  for c in grouped.groups:
    sub_df = grouped.get_group(c)
    # Get the centroid value of dimension 768
    emb_centroids[c] = np.mean(sub_df['Embeddings'], axis=0)

  return emb_centroids
emb_c = get_embedding_centroids(df_train)
# Plot the centroids against the cluster
fig, ax = plt.subplots(figsize=(8,6)) # Set figsize
sns.set_style('darkgrid', {"grid.color": ".6", "grid.linestyle": ":"})
sns.scatterplot(data=df_tsne, x='TSNE1', y='TSNE2', hue='Class Name', palette='Set2');
sns.scatterplot(data=centroids, x='TSNE1', y='TSNE2', color="black", marker='X', s=100, label='Centroids')
sns.move_legend(ax, "upper left", bbox_to_anchor=(1, 1))
plt.title('Scatter plot of news using t-SNE with centroids')
plt.xlabel('TSNE1')
plt.ylabel('TSNE2');
回答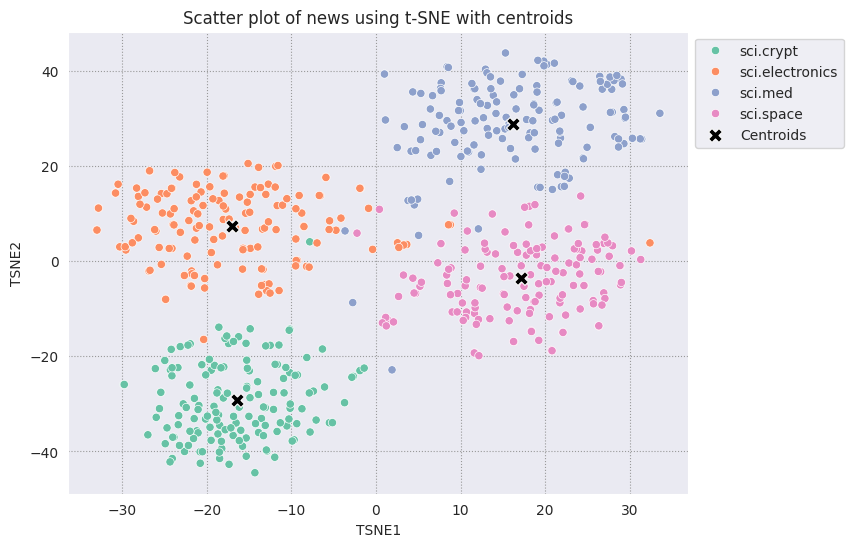
def calculate_euclidean_distance(p1, p2):
  return np.sqrt(np.sum(np.square(p1 - p2)))

def detect_outlier(df, emb_centroids, radius):
  for idx, row in df.iterrows():
    class_name = row['Class Name'] # Get class name of row
    # Compare centroid distances
    dist = calculate_euclidean_distance(row['Embeddings'],
                                        emb_centroids[class_name])
    df.at[idx, 'Outlier'] = dist > radius

  return len(df[df['Outlier'] == True])
range_ = np.arange(0.3, 0.75, 0.02).round(decimals=2).tolist()
num_outliers = []
for i in range_:
  num_outliers.append(detect_outlier(df_train, emb_c, i))
回答
:10: FutureWarning: Setting an item of incompatible dtype is deprecated and will raise in a future error of pandas. Value 'True' has dtype incompatible with float64, please explicitly cast to a compatible dtype first.
df.at[idx, 'Outlier'] = dist > radius
# Plot range_ and num_outliers
fig = plt.figure(figsize = (14, 8))
plt.rcParams.update({'font.size': 12})
plt.bar(list(map(str, range_)), num_outliers)
plt.title("Number of outliers vs. distance of points from centroid")
plt.xlabel("Distance")
plt.ylabel("Number of outliers")
for i in range(len(range_)):
  plt.text(i, num_outliers[i], num_outliers[i], ha = 'center')

plt.show()
回答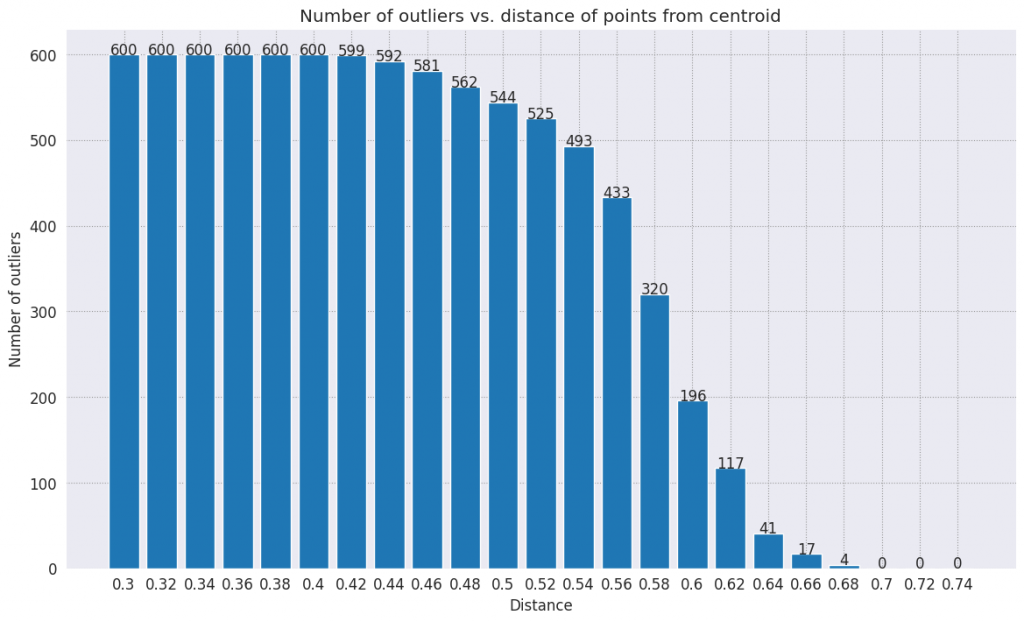
根據想要的異常偵測工具的靈敏度,選擇要使用的半徑範圍。目前系統使用的是 0.62,但您可以變更這個值。
# View the points that are outliers
RADIUS = 0.62
detect_outlier(df_train, emb_c, RADIUS)
df_outliers = df_train[df_train['Outlier'] == True]
df_outliers.head()
回答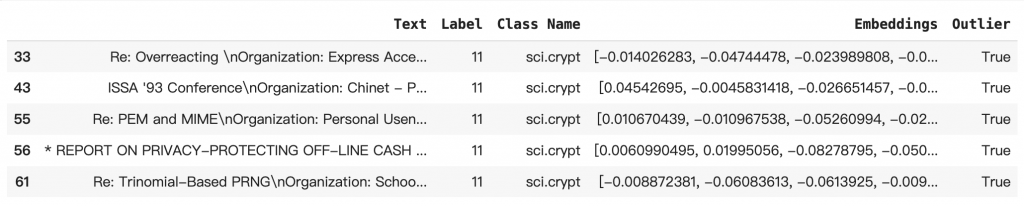
# Use the index to map the outlier points back to the projected TSNE points
outliers_projected = df_tsne.loc[df_outliers['Outlier'].index]
fig, ax = plt.subplots(figsize=(8,6)) # Set figsize
plt.rcParams.update({'font.size': 10})
sns.set_style('darkgrid', {"grid.color": ".6", "grid.linestyle": ":"})
sns.scatterplot(data=df_tsne, x='TSNE1', y='TSNE2', hue='Class Name', palette='Set2');
sns.scatterplot(data=centroids, x='TSNE1', y='TSNE2', color="black", marker='X', s=100, label='Centroids')
# Draw a red circle around the outliers
sns.scatterplot(data=outliers_projected, x='TSNE1', y='TSNE2', color='red', marker='o', alpha=0.5, s=90, label='Outliers')
sns.move_legend(ax, "upper left", bbox_to_anchor=(1, 1))
plt.title('Scatter plot of news with outliers projected with t-SNE')
plt.xlabel('TSNE1')
plt.ylabel('TSNE2');
回答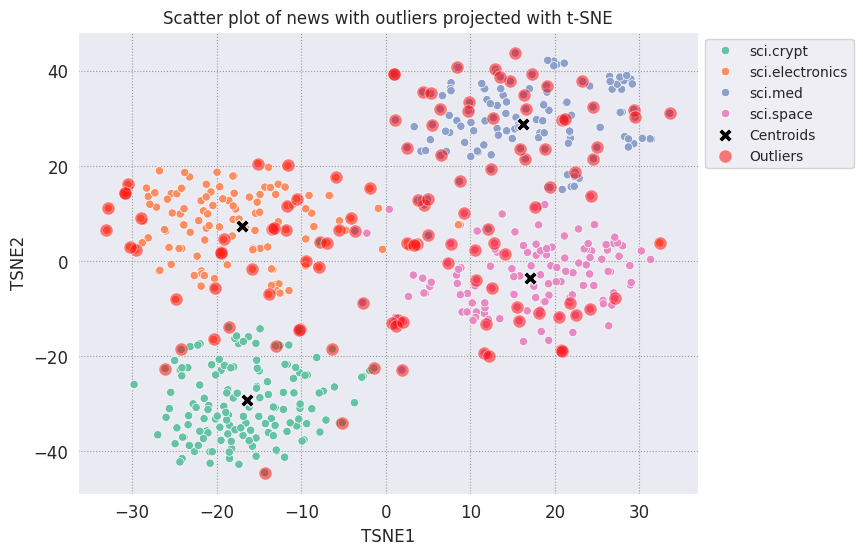
sci_crypt_outliers = df_outliers[df_outliers['Class Name'] == 'sci.crypt']
print(sci_crypt_outliers['Text'].iloc[0])
回答
Re: Overreacting
Organization: Express Access Online Communications, Greenbelt, MD USA
Lines: 13
Distribution: na
NNTP-Posting-Host: access.digex.net
Somebody asked me what was wrong about overreacting in cases such as this.
The reason is very simple: How many people do you want to die in a riot?
In a new Civil War?
Not me -- which is precisely why the government must be cut off at the
knees when it pulls stunts like this, lest the situation worsen to the point
where extreme measures are required.
sci_elec_outliers = df_outliers[df_outliers['Class Name'] == 'sci.electronics']
print(sci_elec_outliers['Text'].iloc[0])
回答
Re: Adcom cheap products?
Organization: Stratus Computer, Marlboro Ma.
Lines: 20
NNTP-Posting-Host: m3-enet.eng.stratus.com
Off-shore assembly is one reason that Adcom is able to make products
that perform as well as those from people like Audio Research and Van
Alstine , but at a much lower cost.
How do you spell "tuna helper" ?
I gather by off-shore assembly you mean that adcoms are built by
blue-fin tuna's who are into that squid-fi sound? .
My Adcom 555 preamp did sound better after installing the famous
"running the chips class "A" resistor mod", and replacing the metal
bottom cover with plexiglass,, too bad the factory could not make em sound
better,, but better sound, unfortunately, does not appear to be a priority
with Adcom, else the mods would neither have been necessary, nor would they
have improved what was already touted as superlative state-o-d-art le'sound.
I really want to hear from all those people out there who have traded up
from an sp9II to a GFP-555/etc., or maybe from those that
have dumped their forte' amps for a GFA-555/etc....
sci_med_outliers = df_outliers[df_outliers['Class Name'] == 'sci.med']
print(sci_med_outliers['Text'].iloc[0])
回答
Re: The Andromeda Strain
Summary: How well does it hold up?
Organization: Telectronics Pacing Systems
Lines: 43
In article <> writes:
Just had the opportunity to watch this flick on A&E -- some 15 years
since I saw it last.
Wow, the WWII channel did something not-WWII?
I was very interested in the technology demonstrated in this film
for handling infectious diseases .
Clearly they "faked" a lot of the computer & robotic technology;
certainly at the time it was made most of that was science fiction
itself, let alone the idea of a "space germ".
The graphics capabilities of the computers were very faked for movie
audiences who have not ability or patience with numbers. The book was more
realistic in that respect. In all respects, actually. The robotics are
still out of range, but not impossible.
Quite coincidentally [actually this is what got me wanted to see
the movie again] I watched a segment on the otherwise awful How'd
They Do That? dealing with a disease researcher at the CDC's top
lab. There was description of the elaborate security measures taken
so that building will never be "cracked" so to speak by man or
nature . And
the researchers used "spacesuits" similar to that in the film.
SF is
usually ahead of science in both prediction and precaution. NASA's
decontaimination processes were supposedly taken to prevent SF story
disasters. I mean, NASA scientists were often SF readers and felt pre-warned by their reading.
I'm curious what people think about this film -- short of "silly".
Is such a facility technically feasible today?
I think the film still holds up among the best of SF films, but that isn't
saying a whole lot.
As far as the plot, and the crystalline structure that is not Life
As We Know It, that's a whole 'nother argument for rec.arts.sf.tech
or something.
Yep.
sci_space_outliers = df_outliers[df_outliers['Class Name'] == 'sci.space']
print(sci_space_outliers['Text'].iloc[0])
回答
Re: Sunrise/ sunset times
Nntp-Posting-Host: wren
Organization: Applied Research Labs, University of Texas at Austin
Lines: 13
writes:
Hello. I am looking for a program that can be used
to compute sunrise and sunset times.
Would you mind posting the responses you get?
I am also interested, and there may be others.
Thanks,
N. Shirlene Pearson