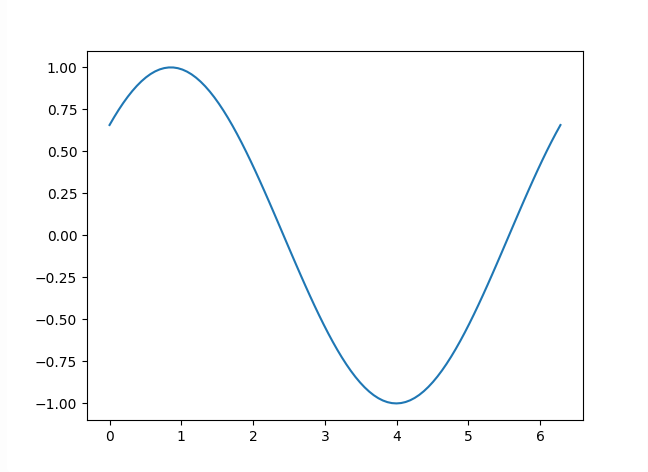
使用 matplotlib.animation 模組,我們可以輕鬆地創建動態折線圖,展示資料如何隨時間變化。
import matplotlib.pyplot as plt
import numpy as np
import matplotlib.animation as animation

# 創建資料
x = np.linspace(0, 2*np.pi, 100)
y = np.sin(x)

# 初始化圖形
fig, ax = plt.subplots()
line, = ax.plot(x, y)

# 更新函數
def update(num, x, y, line):
    line.set_ydata(np.sin(x + num / 10.0))
    return line,

# 創建動畫
ani = animation.FuncAnimation(fig, update, frames=100, fargs=[x, y, line], interval=100)

# 顯示動畫
plt.show()
animation.FuncAnimation:這個函數用於創建動畫,每次更新圖像時會調用 update 函數來刷新圖表。frames:表示動畫的幀數,每一幀都會更新一次資料。interval:表示兩幀之間的時間間隔(單位:毫秒)。
會像這樣,但是動畫。
除了折線圖,我們還可以創建動態散點圖,展示資料點如何移動。
import matplotlib.pyplot as plt
import numpy as np
import matplotlib.animation as animation

# 創建資料
x = np.random.rand(10)
y = np.random.rand(10)
colors = np.random.rand(10)

# 初始化圖形
fig, ax = plt.subplots()
scat = ax.scatter(x, y, c=colors, s=100)

# 更新函數
def update(num):
    scat.set_offsets(np.random.rand(10, 2))  # 隨機移動資料點
    scat.set_array(np.random.rand(10))       # 隨機變化顏色
    return scat,

# 創建動畫
ani = animation.FuncAnimation(fig, update, frames=100, interval=200)

# 顯示動畫
plt.show()
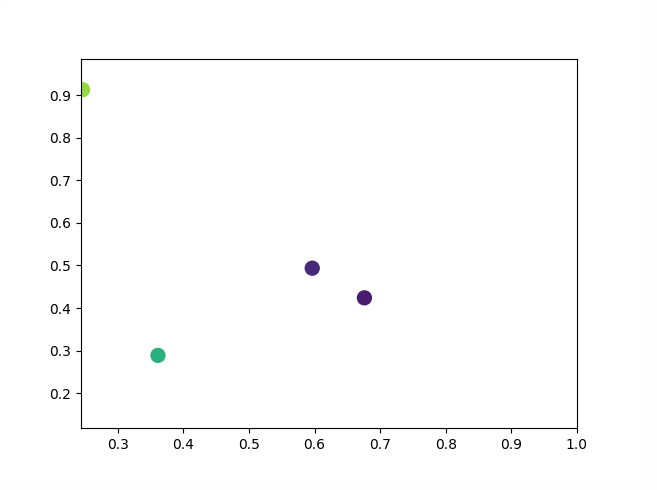
scat.set_offsets():用於更新資料點的位置。scat.set_array():用於變更資料點的顏色。
生成出的動畫如圖:
點會隨機生成,且顏色也會改變。
這篇文章中,我們介紹了如何使用 Matplotlib 創建動畫圖表,通過動態折線圖和散點圖,我們能夠展示資料隨著時間的變化。
