在昨天中我們學會了基本的 NLP 技術來分析文字的情緒,在本課中,我們將學習如何將情緒指標納入交易決策,並評估策略的性能。我們將使用從 CNBC 新聞中提取的情緒數據,結合技術分析,構建一個完整的交易策略。最後,我們將使用回測的方法評估策略的有效性。今日 Colab

我們需要以下 Python 庫:
!pip install pandas numpy matplotlib
!pip install nltk
!pip install newsapi-python
!pip install yfinance
!pip install backtrader
import pandas as pd
import numpy as np
import matplotlib.pyplot as plt
import nltk
from nltk.sentiment import SentimentIntensityAnalyzer
from newsapi import NewsApiClient
import yfinance as yf
import backtrader as bt
import datetime
nltk.download('vader_lexicon')
nltk.download('punkt')
因為今天我們用的newsapi免費版本身只能抓到最近一個月,因此我們今天的例子會是一個月的股價例子,若是讀者有升級帳號等即可在自行更改範圍。我們將使用 yfinance 獲取蘋果公司(AAPL)的歷史股價數據,日期範圍為 2024-09-07 至 2024-10-05。
# 定義日期範圍
start_date = '2024-09-07'
end_date = '2024-10-05'

# 獲取數據
data = yf.download('AAPL', start=start_date, end=end_date)
data.reset_index(inplace=True)
data['Date'] = pd.to_datetime(data['Date'])

為了遵守網站的服務條款,我們將使用 NewsAPI 這個合法的新聞 API 來獲取 CNBC 的新聞文章。
您需要在 NewsAPI 官方網站 註冊一個免費帳戶,並獲取您的 API 金鑰。
# 替換為您的 NewsAPI API 金鑰
newsapi = NewsApiClient(api_key='YOUR_NEWSAPI_KEY')
def get_news_sentiments(keyword, from_date, to_date):
    all_articles = newsapi.get_everything(
        q=keyword,
        domains='cnbc.com',
        from_param=from_date,
        to=to_date,
        language='en',
        sort_by='publishedAt',
        page_size=100
    )

    articles = all_articles['articles']
    sia = SentimentIntensityAnalyzer()
    sentiments = []

    for article in articles:
        published_at = article['publishedAt'][:10]
        title = article['title'] or ''
        description = article['description'] or ''
        text = title + ' ' + description
        score = sia.polarity_scores(text)['compound']
        sentiments.append({'Date': published_at, 'Sentiment': score})

    sentiment_df = pd.DataFrame(sentiments)
    sentiment_df['Date'] = pd.to_datetime(sentiment_df['Date'])
    return sentiment_df
# 獲取新聞情緒數據
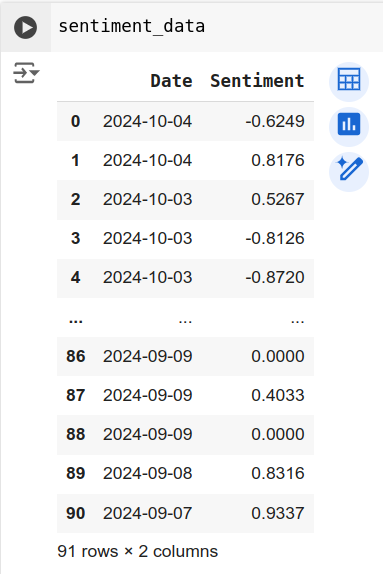
sentiment_data = get_news_sentiments('Apple', start_date, end_date)
可以得到:
# 按日期計算平均情緒得分
daily_sentiment = sentiment_data.groupby('Date').mean().reset_index()

# 合併數據
merged_data = pd.merge(data, daily_sentiment, on='Date', how='left')
merged_data['Sentiment'].fillna(0, inplace=True)
我們將在 Backtrader 中定義一個自訂策略,該策略將結合情緒指標和移動平均線進行交易決策。
class SentimentStrategy(bt.Strategy):
    params = (
        ('short_window', 5),
        ('long_window', 10),
        ('sentiment_threshold', 0.05),
    )

    def __init__(self):
        # 定義移動平均線
        self.sma_short = bt.indicators.SimpleMovingAverage(self.datas[0].close, period=self.params.short_window)
        self.sma_long = bt.indicators.SimpleMovingAverage(self.datas[0].close, period=self.params.long_window)

        # 獲取情緒指標
        self.sentiment = self.datas[0].sentiment

        # 記錄交易訊號
        self.order = None

    def next(self):
        if self.order:
            return  # 如果有未完成的訂單,則不執行新的交易

        if not self.position:
            # 買入條件
            if self.sma_short[0] > self.sma_long[0] and self.sentiment[0] > self.params.sentiment_threshold:
                self.order = self.buy()
        else:
            # 賣出條件
            if self.sma_short[0] < self.sma_long[0] or self.sentiment[0] < -self.params.sentiment_threshold:
                self.order = self.sell()

    def notify_order(self, order):
        if order.status in [order.Completed]:
            if order.isbuy():
                print(f"買入: {order.executed.price}, 日期: {self.data.datetime.date(0)}")
            elif order.issell():
                print(f"賣出: {order.executed.price}, 日期: {self.data.datetime.date(0)}")
            self.bar_executed = len(self)
        self.order = None  # 重置訂單變量
Backtrader 需要將數據封裝為特定的格式。
# 自訂數據饋入類,包含情緒指標
class PandasData_Sentiment(bt.feeds.PandasData):
    lines = ('sentiment',)
    params = (
        ('sentiment', -1),
    )
# 將數據設置為索引
merged_data.set_index('Date', inplace=True)

# 創建數據饋入
data_feed = PandasData_Sentiment(dataname=merged_data)
# 設置 Cerebro
cerebro = bt.Cerebro()
cerebro.adddata(data_feed)
cerebro.addstrategy(SentimentStrategy)
cerebro.broker.setcash(100000.0)
cerebro.broker.setcommission(commission=0.001)

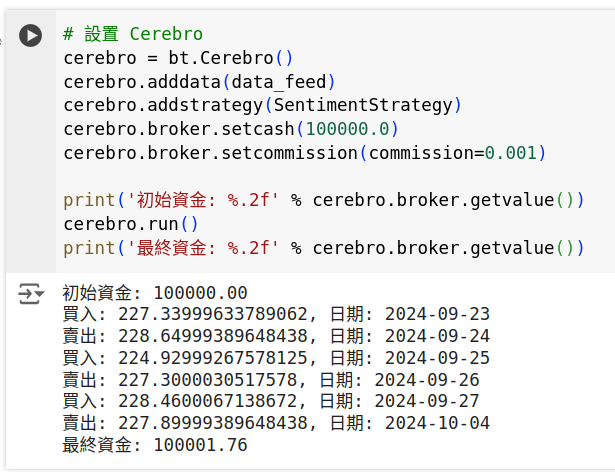
print('初始資金: %.2f' % cerebro.broker.getvalue())
cerebro.run()
print('最終資金: %.2f' % cerebro.broker.getvalue())

%matplotlib inline
plt.rcParams['figure.figsize'] = [15, 12]
plt.rcParams.update({'font.size': 12})
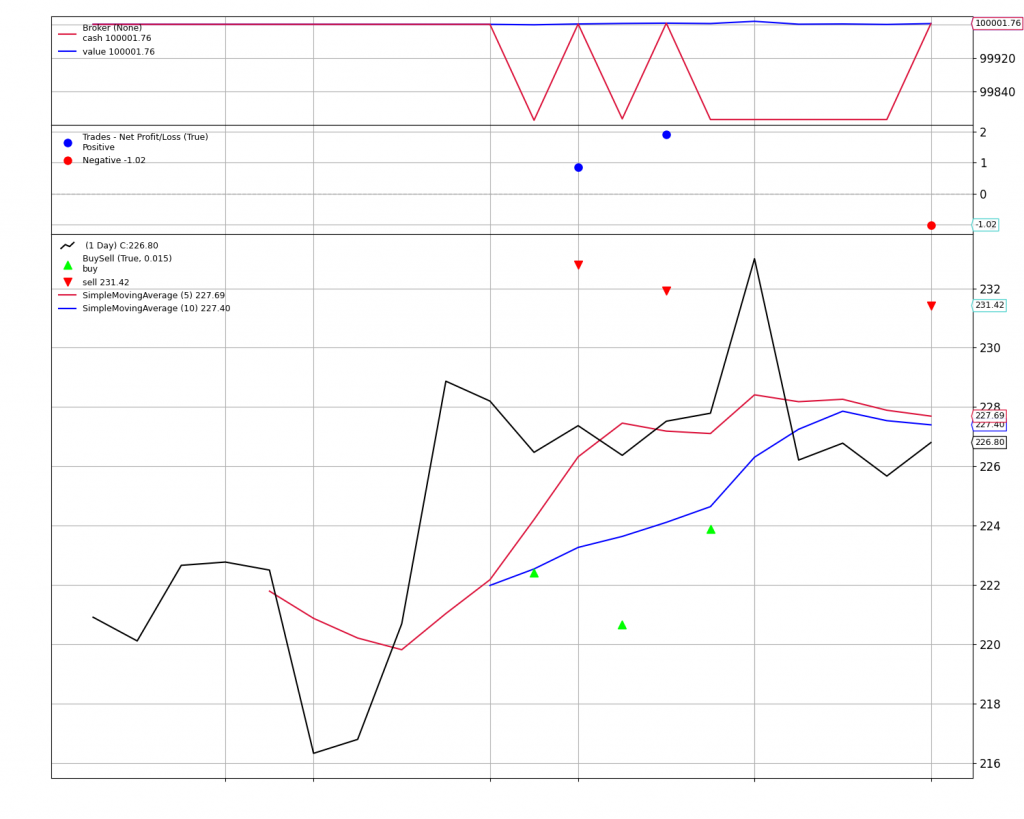
img = cerebro.plot(iplot = False)
img[0][0].savefig('backtrader_sentiment.png')

# 計算總收益
final_value = cerebro.broker.getvalue()
profit = final_value - 100000.0
print(f"總收益: {profit:.2f}")

# 計算年化收益率
days = (merged_data.index[-1] - merged_data.index[0]).days
if days > 0:
    cagr = (final_value / 100000.0) ** (365.0 / days) - 1
    print(f"年化收益率: {cagr:.2%}")
else:
    print("日期範圍不足以計算年化收益率。")

# 持有收益
initial_price = merged_data['Close'][0]
final_price = merged_data['Close'][-1]
hold_return = (final_price / initial_price) - 1
print(f"持有期間的收益率: {hold_return:.2%}")

在本課中,我們:
希望通過本課的學習,能夠掌握將情緒分析納入交易策略的方法,並能夠獨立評估和改進策略性能。
# 安裝必要的庫
!pip install pandas numpy matplotlib
!pip install nltk
!pip install newsapi-python
!pip install yfinance
!pip install backtrader

# 導入庫
import pandas as pd
import numpy as np
import matplotlib.pyplot as plt
import nltk
from nltk.sentiment import SentimentIntensityAnalyzer
from newsapi import NewsApiClient
import yfinance as yf
import backtrader as bt
import datetime

# 下載 NLTK 資源
nltk.download('vader_lexicon')
nltk.download('punkt')

# 替換為您的 NewsAPI API 金鑰
newsapi = NewsApiClient(api_key='YOUR_NEWSAPI_KEY')

# 定義日期範圍
start_date = '2024-09-07'
end_date = '2024-10-05'

# 獲取 AAPL 歷史數據
data = yf.download('AAPL', start=start_date, end=end_date)
data.reset_index(inplace=True)
data['Date'] = pd.to_datetime(data['Date'])

# 定義函數以在特定日期範圍內獲取新聞
def get_news_sentiments(keyword, from_date, to_date):
    all_articles = newsapi.get_everything(
        q=keyword,
        domains='cnbc.com',
        from_param=from_date,
        to=to_date,
        language='en',
        sort_by='publishedAt',
        page_size=100
    )

    articles = all_articles['articles']
    sia = SentimentIntensityAnalyzer()
    sentiments = []

    for article in articles:
        published_at = article['publishedAt'][:10]
        title = article['title'] or ''
        description = article['description'] or ''
        text = title + ' ' + description
        score = sia.polarity_scores(text)['compound']
        sentiments.append({'Date': published_at, 'Sentiment': score})

    sentiment_df = pd.DataFrame(sentiments)
    sentiment_df['Date'] = pd.to_datetime(sentiment_df['Date'])
    return sentiment_df

# 獲取新聞情緒數據
sentiment_data = get_news_sentiments('Apple', start_date, end_date)

# 按日期計算平均情緒得分
daily_sentiment = sentiment_data.groupby('Date').mean().reset_index()

# 合併數據
merged_data = pd.merge(data, daily_sentiment, on='Date', how='left')
merged_data['Sentiment'].fillna(0, inplace=True)

# 自訂數據饋入類,包含情緒指標
class PandasData_Sentiment(bt.feeds.PandasData):
    lines = ('sentiment',)
    params = (
        ('sentiment', -1),
    )

# 將數據設置為索引
merged_data.set_index('Date', inplace=True)

# 創建數據饋入
data_feed = PandasData_Sentiment(dataname=merged_data)

# 定義交易策略
class SentimentStrategy(bt.Strategy):
    params = (
        ('short_window', 5),
        ('long_window', 10),
        ('sentiment_threshold', 0.05),
    )

    def __init__(self):
        # 定義移動平均線
        self.sma_short = bt.indicators.SimpleMovingAverage(self.datas[0].close, period=self.params.short_window)
        self.sma_long = bt.indicators.SimpleMovingAverage(self.datas[0].close, period=self.params.long_window)

        # 獲取情緒指標
        self.sentiment = self.datas[0].sentiment

    def next(self):
        if not self.position:
            # 買入條件
            if self.sma_short[0] > self.sma_long[0] and self.sentiment[0] > self.params.sentiment_threshold:
                self.buy()
        else:
            # 賣出條件
            if self.sma_short[0] < self.sma_long[0] or self.sentiment[0] < -self.params.sentiment_threshold:
                self.sell()

# 設置 Cerebro
cerebro = bt.Cerebro()
cerebro.adddata(data_feed)
cerebro.addstrategy(SentimentStrategy)
cerebro.broker.setcash(100000.0)
cerebro.broker.setcommission(commission=0.001)

print('初始資金: %.2f' % cerebro.broker.getvalue())
cerebro.run()
print('最終資金: %.2f' % cerebro.broker.getvalue())

# 繪製結果
%matplotlib inline
cerebro.plot(iplot=True, volume=False)

# 計算策略績效指標
final_value = cerebro.broker.getvalue()
profit = final_value - 100000.0
print(f"總收益: {profit:.2f}")

days = (merged_data.index[-1] - merged_data.index[0]).days
if days > 0:
    cagr = (final_value / 100000.0) ** (365.0 / days) - 1
    print(f"年化收益率: {cagr:.2%}")
else:
    print("日期範圍不足以計算年化收益率。")

# 持有收益
initial_price = merged_data['Close'][0]
final_price = merged_data['Close'][-1]
hold_return = (final_price / initial_price) - 1
print(f"持有期間的收益率: {hold_return:.2%}")
