在之前的章節中我們針對了技術面以及市場情序進行了探討,在本課中,我們將學習基本面的範疇,包含如何分析企業的財務數據,包括營收、淨利潤和成長率等關鍵指標。我們將使用 Python 進行數據處理,並繪製河流圖(Sankey Diagram)、成長圖等,來直觀地展示企業的財務狀況和成長趨勢。今日 Colab

我們需要以下 Python 庫:
!pip install pandas numpy matplotlib seaborn
!pip install yfinance
!pip install requests
!pip install plotly
import pandas as pd
import numpy as np
import matplotlib.pyplot as plt
import seaborn as sns
import yfinance as yf
import requests
import plotly.graph_objects as go

我們將使用 FinancialModelingPrep(FMP)API 來獲取企業的財務報表數據。您需要在 FMP 官網 註冊並獲取 API 金鑰。另外也推薦看看這個連結學怎麼看財報!
# 替換為您的 FMP API 金鑰
api_key = 'YOUR_FMP_API_KEY'

# 定義要分析的公司,例如 Apple(AAPL)
symbol = 'AAPL'
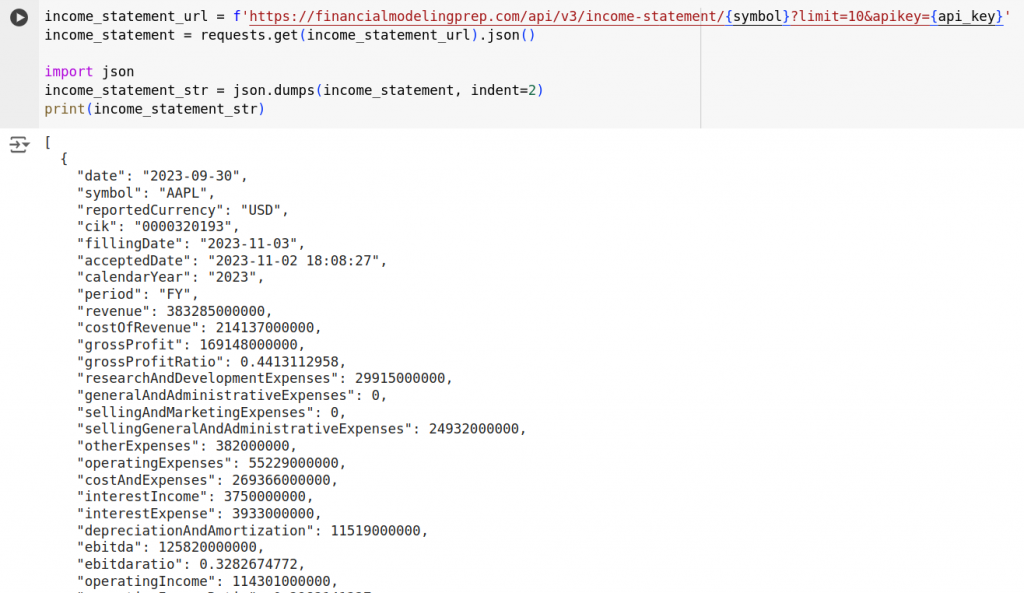
income_statement_url = f'https://financialmodelingprep.com/api/v3/income-statement/{symbol}?limit=10&apikey={api_key}'
income_statement = requests.get(income_statement_url).json()

import json
income_statement_str = json.dumps(income_statement, indent=2)
print(income_statement_str)
可以得到:
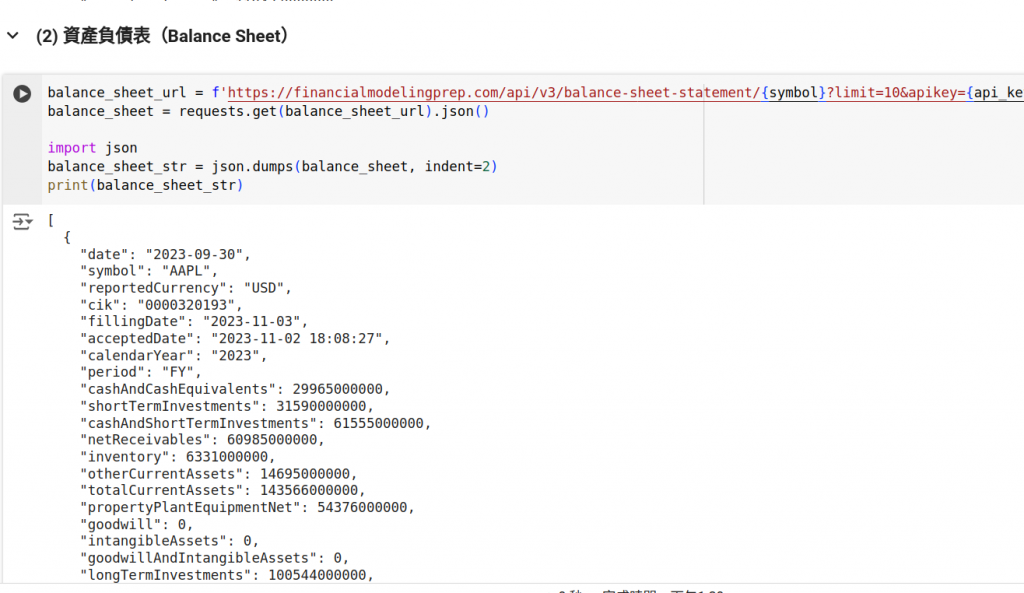
balance_sheet_url = f'https://financialmodelingprep.com/api/v3/balance-sheet-statement/{symbol}?limit=10&apikey={api_key}'
balance_sheet = requests.get(balance_sheet_url).json()

import json
balance_sheet_str = json.dumps(balance_sheet, indent=2)
print(balance_sheet_str)
可以得到:
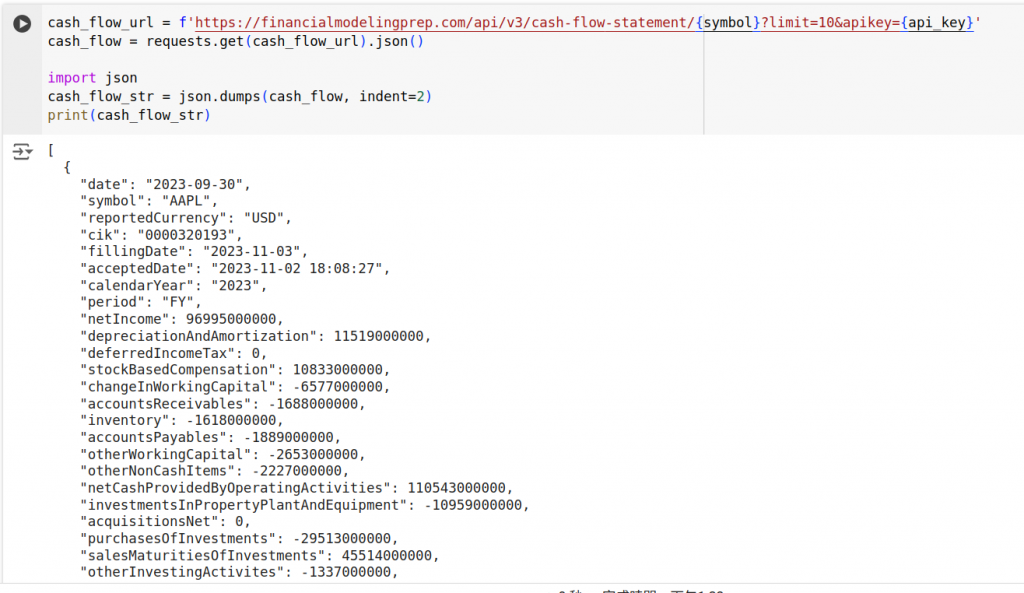
cash_flow_url = f'https://financialmodelingprep.com/api/v3/cash-flow-statement/{symbol}?limit=10&apikey={api_key}'
cash_flow = requests.get(cash_flow_url).json()

import json
cash_flow_str = json.dumps(cash_flow, indent=2)
print(cash_flow_str)
可以得到:
income_df = pd.DataFrame(income_statement)
balance_df = pd.DataFrame(balance_sheet)
cash_flow_df = pd.DataFrame(cash_flow)
我們將關注以下指標:
營收(Revenue):企業在一定期間內通過銷售產品或提供服務所獲得的總收入。營收是評估企業市場份額和經營能力的基本指標。
淨利潤(Net Income):在扣除所有成本、費用、利息和稅金後的最終利潤。淨利潤反映了企業的盈利能力,是投資者關注的核心數據。
總資產(Total Assets):企業擁有的所有資產總額,包括現金、應收賬款、固定資產等。總資產可以衡量企業的規模和資源豐富程度。
股東權益(Total Stockholders Equity):企業的淨資產,即總資產減去總負債。股東權益代表了股東在企業中的權益,是評估財務健康和風險的重要指標。
我們選擇這些指標是因為它們能夠提供關於企業收入來源、盈利能力、資產狀況和財務穩健性的全面視圖,有助於我們深入分析企業的財務表現。
financial_data = income_df[['date', 'revenue', 'netIncome', 'costOfRevenue', 'grossProfit', 'operatingExpenses']].copy()
financial_data['totalAssets'] = balance_df['totalAssets']
financial_data['totalEquity'] = balance_df['totalStockholdersEquity']
financial_data['freeCashFlow'] = cash_flow_df['freeCashFlow']
financial_data['date'] = pd.to_datetime(financial_data['date'])
financial_data.sort_values('date', inplace=True)
financial_data.reset_index(drop=True, inplace=True)
我們將計算以下財務指標:
公式:

Python 實現:
financial_data['revenueGrowth'] = financial_data['revenue'].pct_change()
解釋:
公式:

Python 實現:
financial_data['netProfitMargin'] = financial_data['netIncome'] / financial_data['revenue']
解釋:
公式:

Python 實現:
financial_data['ROA'] = financial_data['netIncome'] / financial_data['totalAssets']
解釋:
公式:

Python 實現:
financial_data['ROE'] = financial_data['netIncome'] / financial_data['totalEquity']
解釋:
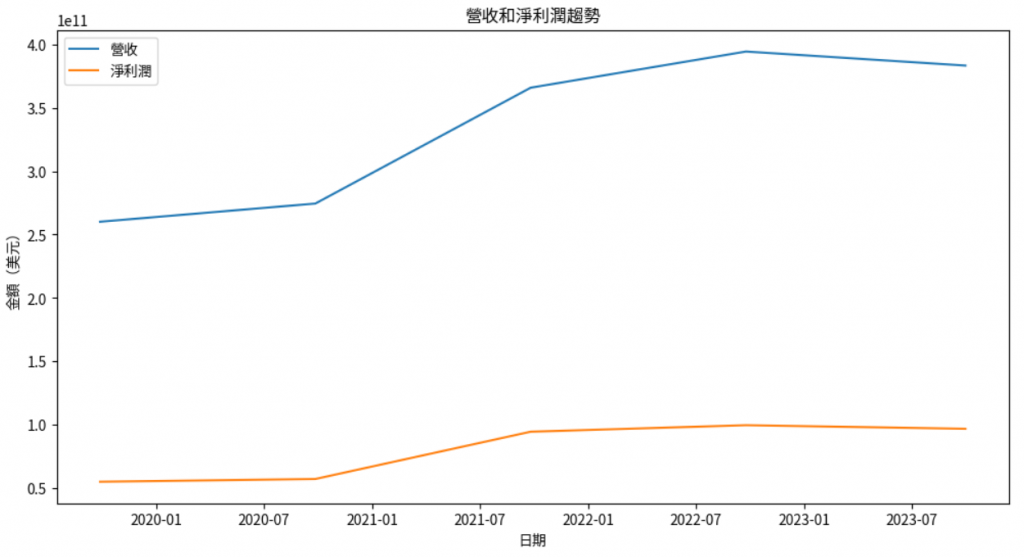
我們將繪製營收和淨利潤隨時間變化的趨勢圖,以觀察它們的走勢和關係。
plt.figure(figsize=(12, 6))
sns.lineplot(data=financial_data, x='date', y='revenue', label='營收')
sns.lineplot(data=financial_data, x='date', y='netIncome', label='淨利潤')
plt.title('營收和淨利潤趨勢')
plt.xlabel('日期')
plt.ylabel('金額(美元)')
plt.legend()
plt.show()
繪製營收增長率的柱狀圖,直觀展示營收增長的速度和波動。
plt.figure(figsize=(12, 6))
sns.barplot(data=financial_data, x='date', y='revenueGrowth')
plt.title('營收增長率')
plt.xlabel('日期')
plt.ylabel('增長率')
plt.show()
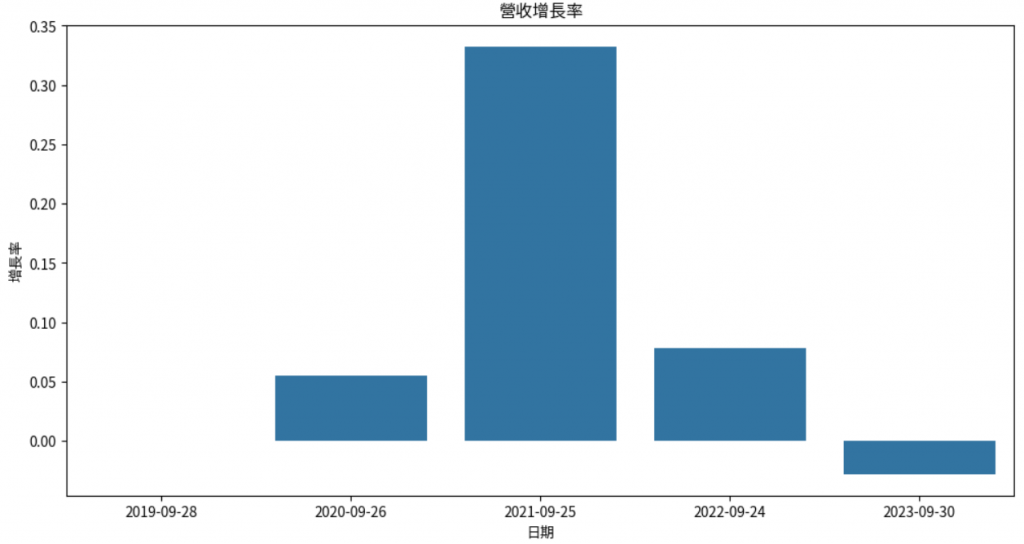
將淨利潤率、ROA、ROE 繪製在同一圖表中,方便比較各指標的變化。
plt.figure(figsize=(12, 6))
sns.lineplot(data=financial_data, x='date', y='netProfitMargin', label='淨利潤率')
sns.lineplot(data=financial_data, x='date', y='ROA', label='ROA')
sns.lineplot(data=financial_data, x='date', y='ROE', label='ROE')
plt.title('盈利能力指標')
plt.xlabel('日期')
plt.ylabel('比率')
plt.legend()
plt.show()
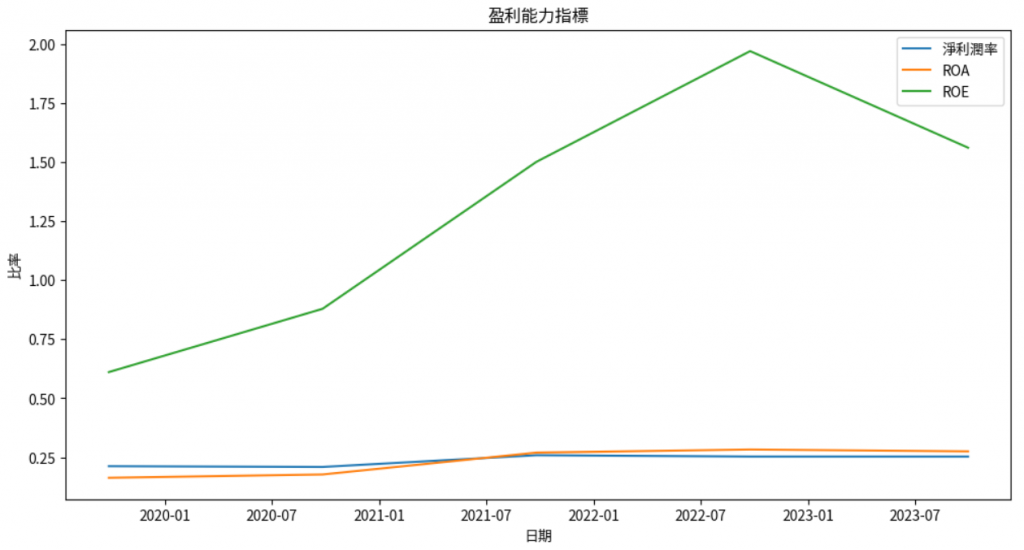
河流圖可以直觀地展示資金或能量的流動。在財務分析中,我們可以使用河流圖來展示營收如何被分配到成本、費用,最終得到淨利潤。
解釋:
程式碼:
這張圖是用 Plotly 做的互動的圖,歡迎上 Colab體驗
# 準備數據
labels = ['營收', '營業成本', '毛利', '營業費用', '淨利潤']
sources = [0, 0, 2, 2]  # 資金流的起始節點
targets = [2, 1, 3, 4]  # 資金流的目標節點
values = [
    financial_data['revenue'].iloc[-1],  # 營收
    -financial_data['costOfRevenue'].iloc[-1],  # 負的營業成本
    financial_data['grossProfit'].iloc[-1],  # 毛利
    -financial_data['operatingExpenses'].iloc[-1],  # 負的營業費用
]

# 建立河流圖
fig = go.Figure(data=[go.Sankey(
    node=dict(
        pad=15,
        thickness=20,
        line=dict(color="black", width=0.5),
        label=labels,
    ),
    link=dict(
        source=sources,
        target=targets,
        value=values
    ))])

fig.update_layout(title_text="財務河流圖", font_size=10)
fig.show()

說明:
節點(Nodes):
連結(Links):
視覺化效果:
# 安裝必要的庫
!pip install pandas numpy matplotlib seaborn
!pip install yfinance
!pip install requests
!pip install plotly

# 導入庫
import pandas as pd
import numpy as np
import matplotlib.pyplot as plt
import seaborn as sns
import yfinance as yf
import requests
import plotly.graph_objects as go

# 替換為您的 FMP API 金鑰
api_key = 'YOUR_FMP_API_KEY'

# 定義要分析的公司
symbol = 'AAPL'

# 獲取財務報表
income_statement_url = f'https://financialmodelingprep.com/api/v3/income-statement/{symbol}?limit=10&apikey={api_key}'
income_statement = requests.get(income_statement_url).json()

balance_sheet_url = f'https://financialmodelingprep.com/api/v3/balance-sheet-statement/{symbol}?limit=10&apikey={api_key}'
balance_sheet = requests.get(balance_sheet_url).json()

cash_flow_url = f'https://financialmodelingprep.com/api/v3/cash-flow-statement/{symbol}?limit=10&apikey={api_key}'
cash_flow = requests.get(cash_flow_url).json()

# 轉換為 DataFrame
income_df = pd.DataFrame(income_statement)
balance_df = pd.DataFrame(balance_sheet)
cash_flow_df = pd.DataFrame(cash_flow)

# 選擇需要的欄位
financial_data = income_df[['date', 'revenue', 'netIncome', 'costOfRevenue', 'grossProfit', 'operatingExpenses']].copy()
financial_data['totalAssets'] = balance_df['totalAssets']
financial_data['totalEquity'] = balance_df['totalStockholdersEquity']
financial_data['freeCashFlow'] = cash_flow_df['freeCashFlow']

# 轉換日期格式
financial_data['date'] = pd.to_datetime(financial_data['date'])
financial_data.sort_values('date', inplace=True)
financial_data.reset_index(drop=True, inplace=True)

# 計算成長率和比率
financial_data['revenueGrowth'] = financial_data['revenue'].pct_change()
financial_data['netProfitMargin'] = financial_data['netIncome'] / financial_data['revenue']
financial_data['ROA'] = financial_data['netIncome'] / financial_data['totalAssets']
financial_data['ROE'] = financial_data['netIncome'] / financial_data['totalEquity']

# 可視化

## 營收和淨利潤趨勢圖
plt.figure(figsize=(12, 6))
sns.lineplot(data=financial_data, x='date', y='revenue', label='營收')
sns.lineplot(data=financial_data, x='date', y='netIncome', label='淨利潤')
plt.title('營收和淨利潤趨勢')
plt.xlabel('日期')
plt.ylabel('金額(美元)')
plt.legend()
plt.show()

## 營收增長率
plt.figure(figsize=(12, 6))
sns.barplot(data=financial_data, x='date', y='revenueGrowth')
plt.title('營收增長率')
plt.xlabel('日期')
plt.ylabel('增長率')
plt.show()

## 淨利潤率、ROA、ROE
plt.figure(figsize=(12, 6))
sns.lineplot(data=financial_data, x='date', y='netProfitMargin', label='淨利潤率')
sns.lineplot(data=financial_data, x='date', y='ROA', label='ROA')
sns.lineplot(data=financial_data, x='date', y='ROE', label='ROE')
plt.title('盈利能力指標')
plt.xlabel('日期')
plt.ylabel('比率')
plt.legend()
plt.show()

## 河流圖
labels = ['營收', '營業成本', '毛利', '營業費用', '淨利潤']
sources = [0, 0, 2, 2]  # 資金流的起始節點
targets = [2, 1, 3, 4]  # 資金流的目標節點
values = [
    financial_data['revenue'].iloc[-1],  # 營收
    -financial_data['costOfRevenue'].iloc[-1],  # 負的營業成本
    financial_data['grossProfit'].iloc[-1],  # 毛利
    -financial_data['operatingExpenses'].iloc[-1],  # 負的營業費用
]

fig = go.Figure(data=[go.Sankey(
    node=dict(
        pad=15,
        thickness=20,
        line=dict(color="black", width=0.5),
        label=labels,
    ),
    link=dict(
        source=sources,
        target=targets,
        value=values
    ))])

fig.update_layout(title_text="財務河流圖", font_size=10)
fig.show()
希望通過本課的學習,能夠掌握財務數據的分析方法,並能夠運用可視化工具直觀地展示分析結果。
