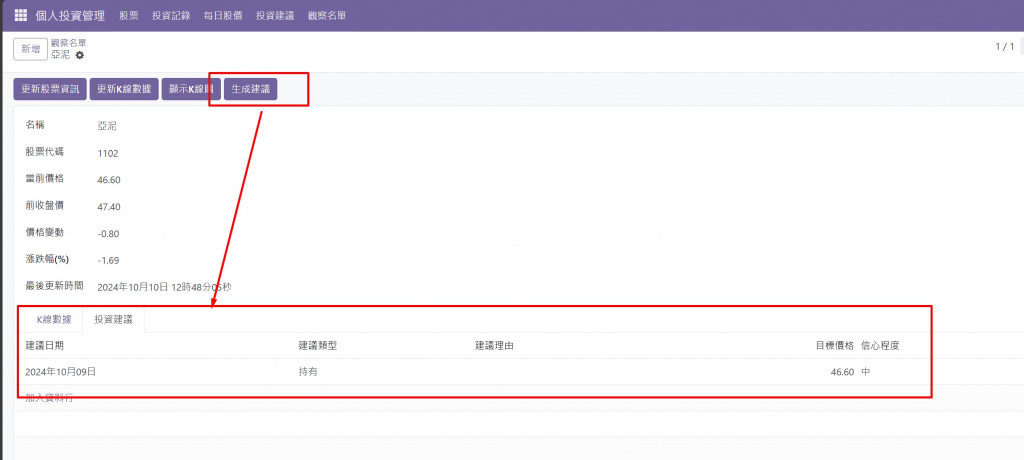
8. **作為一名投資者,我希望能查看觀察名單中股票的預測走勢,以便更快速地做出投資決策。**
@Web @https://github.com/HowardNTUST/Marketing-Data-Science-Application?tab=readme-ov-file
請參考
透過機器學習預測股市漲跌 - 基本資料處理(附Python程式碼)
透過機器學習預測股市漲跌 - 進階資料處理(附Python程式碼)
透過機器學習預測股市漲跌-模型建模(附Python程式碼)
透過機器學習預測股市漲跌 - 模型投資策略驗證(附Python程式碼)
基本資料處理
進階資料處理
模型建模
投資策略驗證
整合到現有系統
stock.prediction 來存儲預測結果stock.watchlist 模型中添加預測相關的字段用戶界面設計
這段程式碼的重點是建立一個股票預測系統,基於技術指標訓練機器學習模型,並對未來價格變化進行預測。以下是程式碼的核心思路和邏輯重點:
class StockPrediction(models.Model):
    _name = 'stock.prediction'
    _description = '股票預測模型'
這個模型 StockPrediction 是用來儲存股票預測的數據。其主要欄位包括:
watchlist_id: 關聯到股票觀察名單,用來指定需要預測的股票數據來源。model: 儲存經過訓練的機器學習模型,以二進位格式存放(使用 pickle 序列化)。last_trained: 儲存模型最後訓練的時間,以便追蹤模型的更新狀態。def prepare_data(self):
kline_data = self.env['stock.kline'].search([('watchlist_id', '=', self.watchlist_id.id)], order='date asc')
# 資料整理並構建DataFrame
df = pd.DataFrame({
'date': kline_data.mapped('date'),
'open': kline_data.mapped('open_price'),
'high': kline_data.mapped('high_price'),
'low': kline_data.mapped('low_price'),
'close': kline_data.mapped('close_price'),
'volume': kline_data.mapped('volume')
})
# 計算額外的技術指標和目標變量
df['returns'] = df['close'].pct_change() # 日內收益率
df['target'] = np.where(df['returns'].shift(-1) > 0, 1, 0) # 預測次日上漲(1)或下跌(0)
# 計算技術指標
df['sma5'] = df['close'].rolling(window=5).mean()
df['sma20'] = df['close'].rolling(window=20).mean()
df['rsi'] = self.calculate_rsi(df['close']) # 計算 RSI 指標
df = df.dropna() # 刪除含有空值的行
# 特徵集和標籤
features = ['open', 'high', 'low', 'close', 'volume', 'sma5', 'sma20', 'rsi']
X = df[features]
y = df['target']
return X, y
這裡的資料準備過程主要是從 stock.kline 中提取 K 線數據,並且計算技術指標(如簡單移動平均線 SMA 和相對強弱指數 RSI)。生成特徵集 X 和目標變量 y,作為後續模型訓練的數據輸入。
returns: 計算每一天的收益率,用來判斷價格變動方向。target: 設定目標變量,預測明天價格上升(1)或下降(0)。sma5, sma20, rsi 是用來增強模型的預測能力。def calculate_rsi(self, prices, period=14):
delta = prices.diff()
gain = (delta.where(delta > 0, 0)).rolling(window=period).mean()
loss = (-delta.where(delta < 0, 0)).rolling(window=period).mean()
rs = gain / loss
return 100 - (100 / (1 + rs))
這個方法用來計算 RSI(相對強弱指數),該指標用來判斷股票是否處於超買或超賣狀態。
def train_model(self):
    X, y = self.prepare_data()  # 準備數據
    X_train, X_test, y_train, y_test = train_test_split(X, y, test_size=0.2, random_state=42)  # 訓練/測試集劃分

    model = RandomForestClassifier(n_estimators=100, random_state=42)  # 使用隨機森林分類器
    model.fit(X_train, y_train)  # 訓練模型

    y_pred = model.predict(X_test)  # 預測測試集
    accuracy = accuracy_score(y_test, y_pred)  # 計算準確度

    self.model = pickle.dumps(model)  # 序列化模型並儲存
    self.last_trained = fields.Datetime.now()  # 更新最後訓練時間

    return accuracy
此方法用來訓練隨機森林模型。使用 train_test_split 方法將資料分為訓練集和測試集,並使用隨機森林分類器進行模型訓練。訓練完成後,模型會被序列化並儲存起來。此方法還會返回模型的準確度。
def make_prediction(self):
    if not self.model:
        return None, 0

    model = pickle.loads(self.model)  # 反序列化已保存的模型
    latest_data = self.prepare_data()[0].iloc[-1].values.reshape(1, -1)  # 使用最新的數據進行預測
    prediction = model.predict(latest_data)[0]  # 進行預測
    confidence = model.predict_proba(latest_data)[0][prediction]  # 預測的置信度

    return prediction, confidence
該方法會使用已訓練好的模型對最新的數據進行預測。首先反序列化模型,然後使用最新的特徵數據進行預測,並返回預測結果和置信度。

這段使用者故事中的需求,是讓投資者能查看觀察名單中股票的預測走勢,以幫助他們快速作出投資決策。結合你提供的 Cursor 工具及 web 參考,整個開發流程可進行以下增強:
stock.kline 提取 K 線數據,並計算移動平均線、RSI 等技術指標。這部分和你的代碼邏輯吻合,已涵蓋準備資料和計算技術指標的需求。這樣的流程確保了投資者可以輕鬆查看預測結果,進而做出更快速的投資決策。
https://github.com/kulius/odoo17_ithelp/tree/master/addons/personal_stock
