昨天我們幫服務加上 /metrics,終於能看見完整的角色面板:血條、藍條、技能冷卻都一清二楚。
但問題來了:
你總不能每天盯著 /metrics 網頁,像刷股票行情一樣看數字吧?
就算你是爆肝工程師,眼睛盯 24/7 ,薪水不會比較多,也可能錯過瞬間的暴擊。
真正的關鍵是:讓系統自己在快掛的時候喊救命。
這就是今天的主角 —— 監控 (Monitoring) 與告警 (Alerting)。
Metrics 本質上就是一堆數字。
單看它們,就像你打開 Excel,看見 CPU=87%、Mem=2.3GB、Request=1234。
然後呢?
缺少的東西是「規則」與「動作」:
沒有這層轉換,metrics 只是一堆靜態數字;有了這層轉換,它才變成可以拯救系統的訊號。
就像遊戲裡不是只看血條,而是要在血量 < 30% 時自動播放語音:
「補師快補!坦克開嘲諷拉怪!」
在現實世界,最常見的組合是:
流程長這樣:
在專案根目錄
(a) docker-compose.monitor.yml
把 Prometheus + Alertmanager 一起起來(可和你的 app 分開跑)
services:
  prometheus:
    image: prom/prometheus:v2.53.0
    container_name: mon-prometheus
    ports:
      - "9090:9090"
    volumes:
      - ./monitoring/prometheus.yml:/etc/prometheus/prometheus.yml:ro
      - ./monitoring/alert.rules.yml:/etc/prometheus/alert.rules.yml:ro
    command:
      - "--config.file=/etc/prometheus/prometheus.yml"
      - "--web.enable-lifecycle"     # 允許熱重載 /-/reload
    networks: [web]
    depends_on:
      - alertmanager

  alertmanager:
    image: prom/alertmanager:v0.27.0
    container_name: mon-alertmanager
    ports:
      - "9093:9093"
    volumes:
      - ./monitoring/alertmanager.yml:/etc/alertmanager/alertmanager.yml:ro
    environment:
      GMAIL_APP_PASSWORD: '${GMAIL_APP_PASSWORD}'
      ENVIRONMENT: prod
    command:
      - "--config.file=/etc/alertmanager/alertmanager.yml"
      - "--log.level=info"
    networks: [web]

networks:
  web: {}   # 與主 compose 的 web 同名即可,Compose 會合併
(b) monitoring/prometheus.yml
Prometheus 抓你的服務 + 報警丟給 Alertmanager。
global:
  scrape_interval: 15s
  evaluation_interval: 15s

alerting:
  alertmanagers:
    - static_configs:
        - targets: ["alertmanager:9093"]

rule_files:
  - /etc/prometheus/alert.rules.yml

scrape_configs:
  # 你的應用(請按你的實際位置改 host:port)
  - job_name: "app"
    static_configs:
      - targets:
          - "app:8000" # 抓本機 8000
          # 或 "app:8000" 如果你的 app 也在 compose network 裡
    metrics_path: /metrics

  # 監控自己(Prometheus)
  - job_name: "prometheus"
    static_configs:
      - targets: ["prometheus:9090"]
  # 測試用的假目標
  - job_name: "fake"
    static_configs:
      - targets: ["127.0.0.1:9999"]
(c) monitoring/alert.rules.yml
兩條規則:InstanceDown 與 HighLatency。
groups:
  - name: core-alerts
    rules:
      # 服務抓不到(ex: app 掛了 / 網路斷)
      - alert: InstanceDown
        expr: up == 0
        for: 15s
        labels:
          severity: critical
        annotations:
          summary: "Target is down: {{ $labels.job }} {{ $labels.instance }}"
          description: "Prometheus cannot scrape {{ $labels.instance }} (job={{ $labels.job }}) for 2m."

      # P95 延遲 > 0.8 秒,持續 5 分鐘
      - alert: HighLatency
        expr: |
          histogram_quantile(
            0.95,
            sum(rate(http_request_latency_seconds_bucket[5m])) by (le)
          ) > 0.8
        for: 5m
        labels:
          severity: warning
        annotations:
          summary: "High p95 latency"
          description: "p95 latency > 0.8s for 5m. Check upstream/downstream bottlenecks."
(d) monitoring/alertmanager.yml
把告警送到 Email
global:
  resolve_timeout: 5m
  smtp_smarthost: 'smtp.gmail.com:587'
  smtp_from: 'hacuba7777@gmail.com'
  smtp_auth_username: 'hacuba7777@gmail.com'
  smtp_auth_password: '${GMAIL_APP_PASSWORD}'
  smtp_require_tls: true
  smtp_hello: 'app.hacuba.site'

route:
  receiver: email
  group_by: ['alertname']
  group_wait: 10s
  group_interval: 1m
  repeat_interval: 5m

receivers:
  - name: email
    email_configs:
      - to: 'hacuba7777+am@gmail.com'
        hello: 'app.hacuba.site'
        auth_identity: 'hacuba7777@gmail.com'   # 有些伺服器對 LOGIN/PLAIN 的 identity 會挑
        require_tls: true
        send_resolved: true
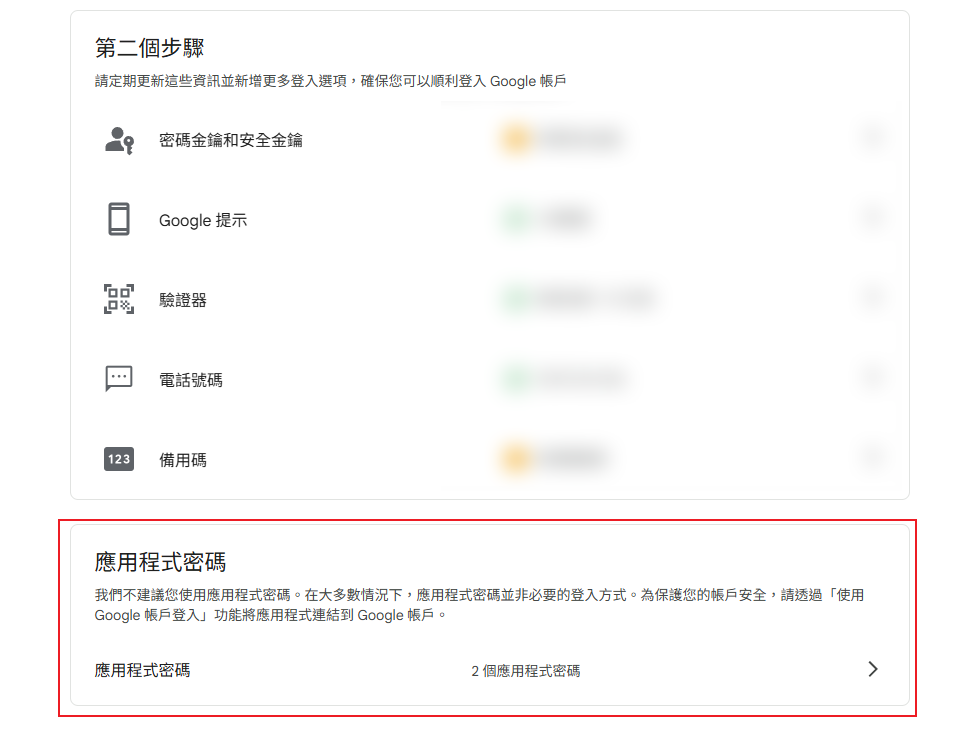
(e) .env(放 repo 根目錄;別忘了 .gitignore)
把你的 GMAIL_APP_PASSWORD 放這。
申請 Google 應用程式密碼步驟:
ENVIRONMENT=dev
GMAIL_APP_PASSWORD=xxxxxxxxxxxxxxxx #16碼
docker compose -f docker-compose.monitor.yml up -d
開起服務:
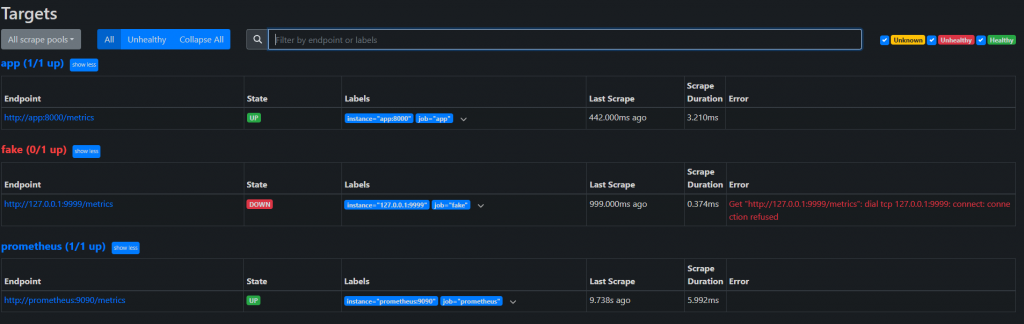
Prometheus UI → Status > Targets,應該看到 app 是 UP。
確認 docker 有順利起來,注意 prometheus 和 alertmanager 對應的 port 有映射正確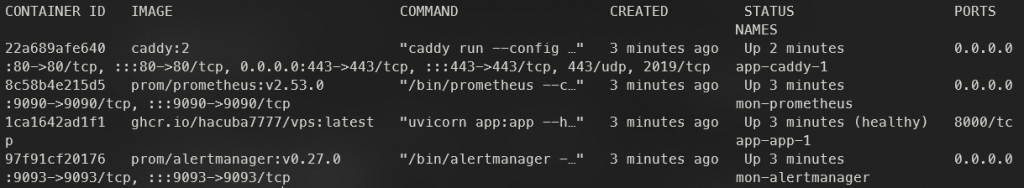
確認 prometheus 的 targets 頁面
確認 alertmanager 的告警頁面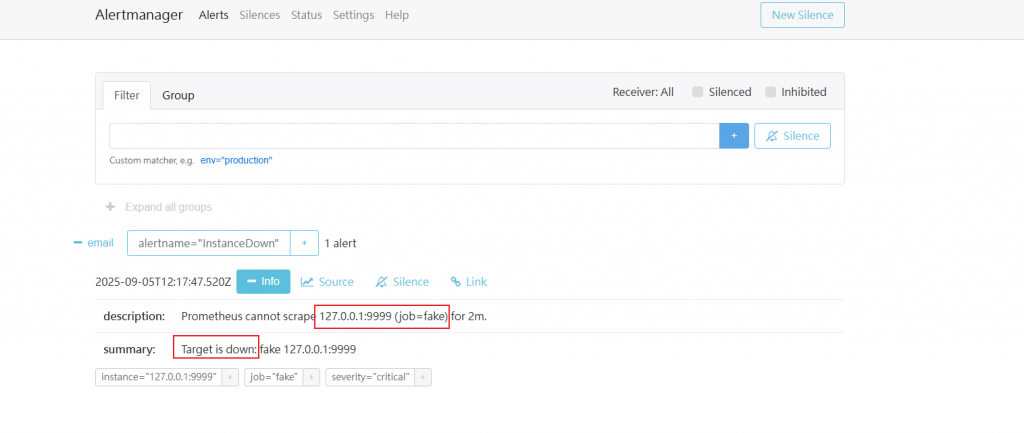
如果沒意外也會收到告警信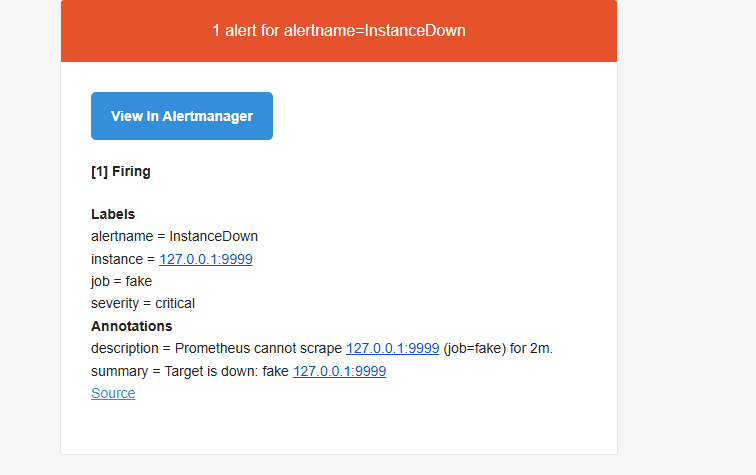
到這裡,我們已經正式從「程式跑得起來」邁向「程式看得到狀態」。
/healthz 是血條,/metrics 是角色面板,而 Prometheus + Alertmanager 則是那個在背後敲鑼打鼓、提醒你「快補血」的隊友。
Devsecops的精神:不是只有跑起來就好,而是能監控、能預警,才算是真的安全上線。
因為在實務上,災難往往不是一瞬間爆炸,而是早就有徵兆:
透過 Metrics、監控與告警,我們不再只是「出事才搶救」,而是能「提前做反應」。
這差別,就像是被王一拳秒殺,跟隊伍提前喊「補師準備!」——結果天差地遠。
觀測能力 = 團隊的第六感。
沒有它,你永遠是在黑暗裡打王;有了它,你能看見數據的紅燈,提早踩煞車。

