經過前三天的 OpenTelemetry 感知系統建設,我們已經有了強大的 metrics 和 tracing 能力。但在微服務的世界裡,還有一個重要的觀測維度:日誌(Logs)。今天我們先從最基礎但最重要的一步開始 - 使用 Fluent Bit 作為 Sidecar 來收集應用程式日誌!
✅ 理解為什麼需要專門的日誌收集系統,而不是簡單的 kubectl logs
✅ 學習 Fluent Bit Sidecar 模式的設計原理
✅ 實戰部署 Fluent Bit 作為 Sidecar 收集應用程式日誌
✅ 配置結構化日誌輸出,為後續的 Loki 整合做準備
場景對比:傳統 vs 現代日誌管理
🔴 傳統做法的痛點:
# 想查看某個服務的錯誤日誌?
kubectl logs -l app=user-service | grep ERROR

# Pod 重啟了,之前的日誌消失了!
kubectl logs user-service-abc123 --previous

# 想要跨多個 Pod 查詢?需要寫複雜的腳本
for pod in $(kubectl get pods -l app=user-service -o name); do
  kubectl logs $pod | grep "payment failed"
done

# 想要歷史趨勢分析?抱歉,做不到!
# 想要關聯不同服務的日誌?更是天方夜譚!
現代日誌收集的優勢 🟢
# 持久化存儲 - Pod 重啟也不怕
# 結構化查詢 - 可以按字段精確搜尋
# 集中管理 - 所有服務的日誌都在一個地方
# 實時分析 - 可以做趨勢分析和告警
# 關聯查詢 - 可以追蹤一個請求跨多個服務的完整路徑
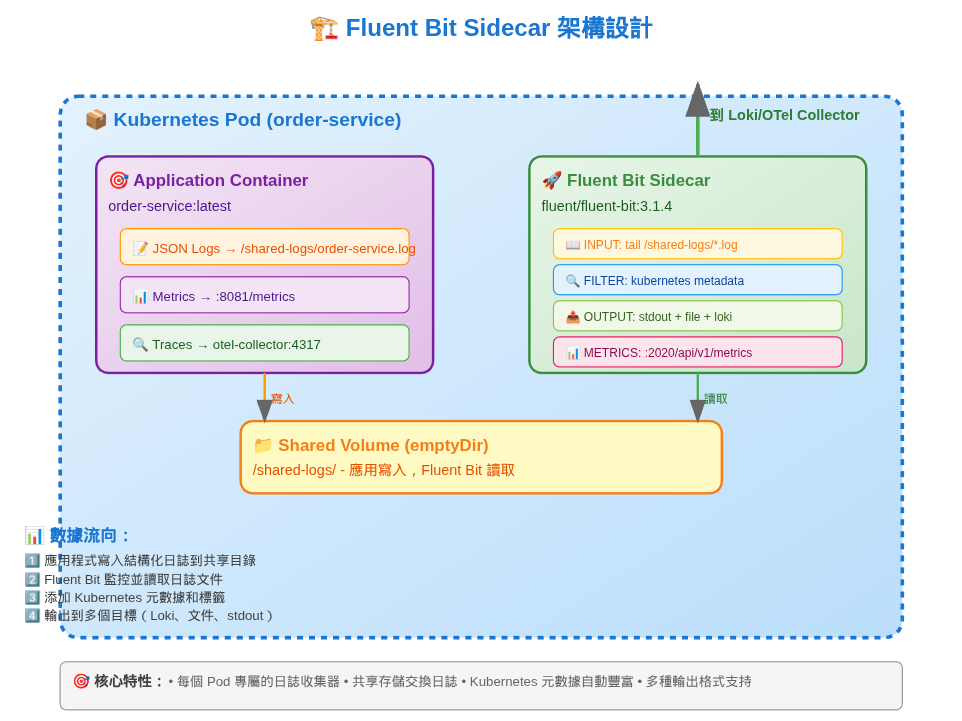
核心概念
fluent-bit-config.yaml
# fluent-bit-config.yaml
apiVersion: v1
kind: ConfigMap
metadata:
  name: fluent-bit-config
  namespace: ecommerce
data:
  fluent-bit.conf: |
    [SERVICE]
        Flush         1
        Log_Level     info
        Daemon        off
        Parsers_File  parsers.conf
        HTTP_Server   On
        HTTP_Listen   0.0.0.0
        HTTP_Port     2020

    # 🎯 讀取共享日誌目錄
    [INPUT]
        Name              tail
        Path              /shared-logs/app.log
        Tag               app.logs
        Refresh_Interval  1
        Mem_Buf_Limit     5MB
        Skip_Long_Lines   On
        Skip_Empty_Lines  On
        Parser            json
        DB                /tmp/fluent-bit-app.db


    [OUTPUT]
        Name   stdout
        Match  app.*
        Format json_lines

  parsers.conf: |
    [PARSER]
        Name        json
        Format      json
        Time_Key    timestamp
        Time_Format %Y-%m-%dT%H:%M:%S.%L
        Time_Keep   On
        Decode_Field_As escaped_utf8 log do_next

    [PARSER]
        Name        docker
        Format      json
        Time_Key    time
        Time_Format %Y-%m-%dT%H:%M:%S.%L
        Time_Keep   On
        Decode_Field_As escaped log
deployments/order-service.yaml
將服務的log導至/shared-logs/app.log
而fluentbit 則監聽這log有沒有新的tail log。
# deployments/order-service.yaml
apiVersion: apps/v1
kind: Deployment
metadata:
 name: order-service
 namespace: ecommerce
 labels:
   app: order-service
   version: v1
spec:
 replicas: 2
 selector:
   matchLabels:
     app: order-service
 template:
   metadata:
     labels:
       app: order-service
       version: v1
     annotations:
       prometheus.io/scrape: "true"
       prometheus.io/port: "8081"
       prometheus.io/path: "/metrics"
       # 🏷️ Fluent Bit 相關註解
       fluentbit.io/parser: "json"
       fluentbit.io/exclude: "false"
   spec:
     serviceAccountName: default

     # 📁 共享存儲卷
     volumes:
     - name: shared-logs
       emptyDir: {}
     - name: fluent-bit-config
       configMap:
         name: fluent-bit-config

     containers:
     # 🎯 主應用容器
     - name: order-service
       image: order-service:latest

       command: ["/bin/sh"]
       args:
       - -c
       - |
         # 確保日誌目錄存在
         mkdir -p /shared-logs
         # 啟動應用並重定向日誌到共享文件
         ./order-service 2>&1 | tee -a /shared-logs/app.log

       volumeMounts:
       - name: shared-logs
         mountPath: /shared-logs


     # 📋 Fluent Bit Sidecar 容器
     - name: fluent-bit
       image: fluent/fluent-bit:2.2.2
       imagePullPolicy: IfNotPresent

       env:
       - name: HOSTNAME
         valueFrom:
           fieldRef:
             fieldPath: spec.nodeName
       - name: FLUENT_CONF
         value: fluent-bit.conf

       volumeMounts:
       - name: fluent-bit-config
         mountPath: /fluent-bit/etc/
       - name: shared-logs
         mountPath: /shared-logs
         readOnly: true

       resources:
         requests:
           memory: "64Mi"
           cpu: "50m"
         limits:
           memory: "128Mi"
           cpu: "100m"

       # 健康檢查
       livenessProbe:
         httpGet:
           path: /
           port: 2020
         initialDelaySeconds: 30
         periodSeconds: 10

       readinessProbe:
         httpGet:
           path: /
           port: 2020
         initialDelaySeconds: 5
         periodSeconds: 5
執行 devspace dev --debug
就能到 devspace ui 看見以下畫面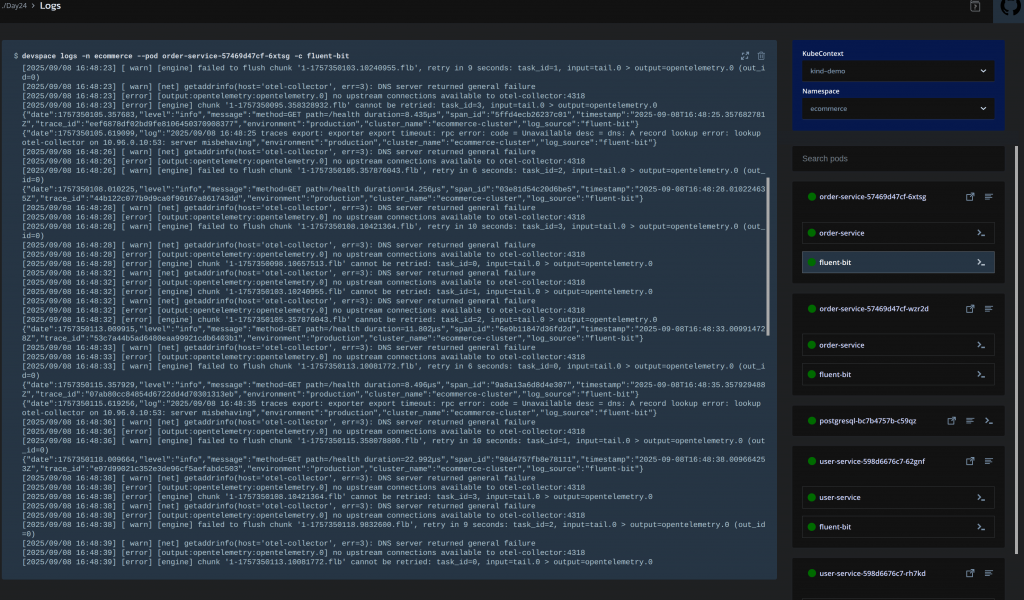
能看見每個應用服務都有一個 fluentbit的容器在旁邊,且也有收到log。
✅ Fluent Bit Sidecar 模式部署完成