經過前幾天建立了微服務王國的基礎設施,今天我們要為這個王國安裝「中央神經系統」!就像人體需要大腦來協調各個器官一樣,我們的微服務架構也需要一個智能的數據收集和處理中心。今天,讓我們用 DevSpace 的魔法,一鍵部署 OpenTelemetry Collector 這個可觀測性的核心大腦!
✅ 理解 OpenTelemetry Collector 在微服務架構中的核心地位
✅ 掌握使用 DevSpace 管理 OTel Collector 的完整流程
✅ 實戰部署多協議 Recevier、智能處理的 Collector 配置
✅ 建立可觀測性數據的中央處理管道
想像你經營一家大型企業,你需要什麼來掌握全局?
| 角色 | 傳統企業 | 微服務架構 | OTel Collector 的作用 |
|---|---|---|---|
| 📊 數據收集 | 各部門手工報表 | 各服務散亂的日誌 | 統一收集所有遙測數據 |
| 🔄 數據處理 | 人工整理分析 | 格式不統一難分析 | 標準化、豐富化、路由 |
| 📈 決策支援 | 週報月報延遲 | 缺乏實時洞察 | 實時處理、智能分析 |
| 🎯 問題定位 | 層層追查耗時 | 跨服務追蹤困難 | 關聯分析、根因定位 |
📋 專案結構設計
otel-collector/
├── devspace.yaml                    # 🎮 DevSpace 總控制台
├── otel-config.yaml                 # ⚙️ Collector 配置檔
└── otel-collector-deployment.yaml   # 🚀 K8s 部署資源
devspace.yaml
# devspace.yaml - 可觀測性中樞的指揮中心
version: v2beta1
name: otel-collector

# 🎭 管道編排 - 就像交響樂的指揮
pipelines:
  dev:
    run: |-
      create_deployments --all    # 🏗️ 建立所有部署資源
      start_dev collector         # 🎮 啟動開發模式
  deploy:
    run: |-
      create_deployments --all    # 🚀 純部署模式

# 🏗️ 部署資源管理 - 有序的建設流程
deployments:
  otel-config:                    # 🎯 先部署配置
    kubectl:
      manifests:
        - ./otel-config.yaml
  otel-collector:                 # 🚀 再部署應用
    kubectl:
      manifests:
        - ./otel-collector-deployment.yaml

# 🎮 開發環境配置 - 讓debug變得簡單
dev:
  collector:
    labelSelector:
      app: otel-collector
    ports:
      - port: "4317"              # 🎯 OTLP gRPC 端口
      - port: "4318"              # 🌐 OTLP HTTP 端口
      - port: "8889"              # 📊 Prometheus 指標端口
      - port: "13133"             # 🏥 Health check 端口
      - port: "24224"             # 📝 Fluent Forward 端口
      - port: "1777"              # 🔬 pprof 效能分析
      - port: "55679"             # 🎭 zPages 調試介面
    open:
      - url: http://localhost:8889/metrics  # 🚀 監測指標頁面
otel-collector-config.yaml
# otel-config.yaml - Collector 的大腦配置
receivers:
  # 🎯 OTLP 接收器 - 標準遙測協議
  otlp:
    protocols:
      grpc:
        endpoint: 0.0.0.0:4317    # 🚀 高效能 gRPC 協議
      http:
        endpoint: 0.0.0.0:4318    # 🌐 通用 HTTP 協議

  # 📝 Fluent Forward 接收器 - 日誌數據專用
  fluentforward:
    endpoint: 0.0.0.0:24224       # 📋 接收 Fluent Bit 日誌

  # 🏥 HTTP 檢查接收器 - 健康監控
  httpcheck:
    targets:
      - endpoint: http://0.0.0.0:8080/health
        method: GET
    collection_interval: 30s      # ⏰ 每30秒檢查一次
processors:
  # 🧠 記憶體限制器 - 防止 OOM
  memory_limiter:
    limit_mib: 400                # 🎯 主記憶體限制 400MB
    spike_limit_mib: 100          # ⚡ 突發記憶體限制 100MB

  # 📦 批次處理器 - 效能優化
  batch:
    timeout: 1s                   # ⏰ 1秒超時
    send_batch_size: 1024         # 📊 批次大小 1024 條記錄
    send_batch_max_size: 2048     # 📈 最大批次 2048 條記錄

  # 🏷️ 資源處理器 - 數據豐富化
  resource:
    attributes:
      - key: k8s.cluster.name     # 🎯 添加集群標識
        value: "ecommerce-cluster"
        action: insert
      - key: environment          # 🌍 添加環境標識
        value: "development"
        action: insert
exporters:
  # 🔍 調試輸出器 - 開發階段必備
  debug:
    verbosity: detailed           # 📋 詳細輸出模式
    sampling_initial: 5           # 🎲 初始採樣 5 條
    sampling_thereafter: 200      # 🔄 後續每 200 條採樣 1 條

  # 📊 Prometheus 輸出器 - 指標數據
  prometheus:
    endpoint: "0.0.0.0:8889"      # 🎯 指標服務端點
    const_labels:                 # 🏷️ 常量標籤
      cluster: ecommerce-cluster
      version: v1.0.0
    resource_to_telemetry_conversion:
      enabled: true               # 🔄 資源屬性轉換

# 🎭 服務管道配置 - 數據流向控制
service:
  pipelines:
    # 📊 指標管道
    metrics:
      receivers: [otlp, httpcheck]
      processors: [memory_limiter, resource, batch]
      exporters: [debug, prometheus]

    # 🔍 tracing 管道
    traces:
      receivers: [otlp]
      processors: [memory_limiter, resource, batch]
      exporters: [debug]

    # 📝 日誌管道
    logs:
      receivers: [fluentforward, otlp]
      processors: [memory_limiter, resource, batch]
      exporters: [debug]
    # 🔧 擴展配置
    extensions:
      # 健康檢查
      health_check:
        endpoint: 0.0.0.0:13133

      # pprof 性能分析
      pprof:
        endpoint: 0.0.0.0:1777

      # zPages 調試頁面
      zpages:
        endpoint: 0.0.0.0:55679

      # 🚨 遙測配置
      telemetry:
        logs:
          level: info
        metrics:
          level: detailed
第一步:環境準備
# 🏗️ 確保 ecommerce 王國存在
kubectl create namespace ecommerce --dry-run=client -o yaml | kubectl apply -f -

# 🎯 進入 Collector 控制室
cd otel-collector/

# 🔍 檢查配置檔案完整性
ls -la
# devspace.yaml ✅
# otel-config.yaml ✅
# otel-collector-deployment.yaml ✅
第二步:一鍵部署魔法
> devspace dev --debug

23:18:56 info Using namespace 'ecommerce'
23:18:56 info Using kube context 'kind-demo'
23:18:56 dev:collector Waiting for pod to become ready...
23:18:56 dev:collector Start selecting a single container with selector label selector: app=otel-collector
23:18:57 dev:collector Selected pod otel-collector-67d794fc79-6p28w
23:18:57 dev:collector open  Opening 'http://localhost:8889/metrics' as soon as application will be started
23:18:57 dev:collector open  Opening 'http://localhost:13133' as soon as application will be started
23:18:57 dev:collector ports Start selecting a single pod with selector pod name: otel-collector-67d794fc79-6p28w
23:18:58 dev:collector ports Port forwarding started on: 4317 -> 4317, 4318 -> 4318, 8889 -> 8889, 13133 -> 13133, 24224 -> 24224, 1777 -> 1777, 55679 -> 55679
23:18:58 debug Wait for dev to finish
第三步:驗證部署成果
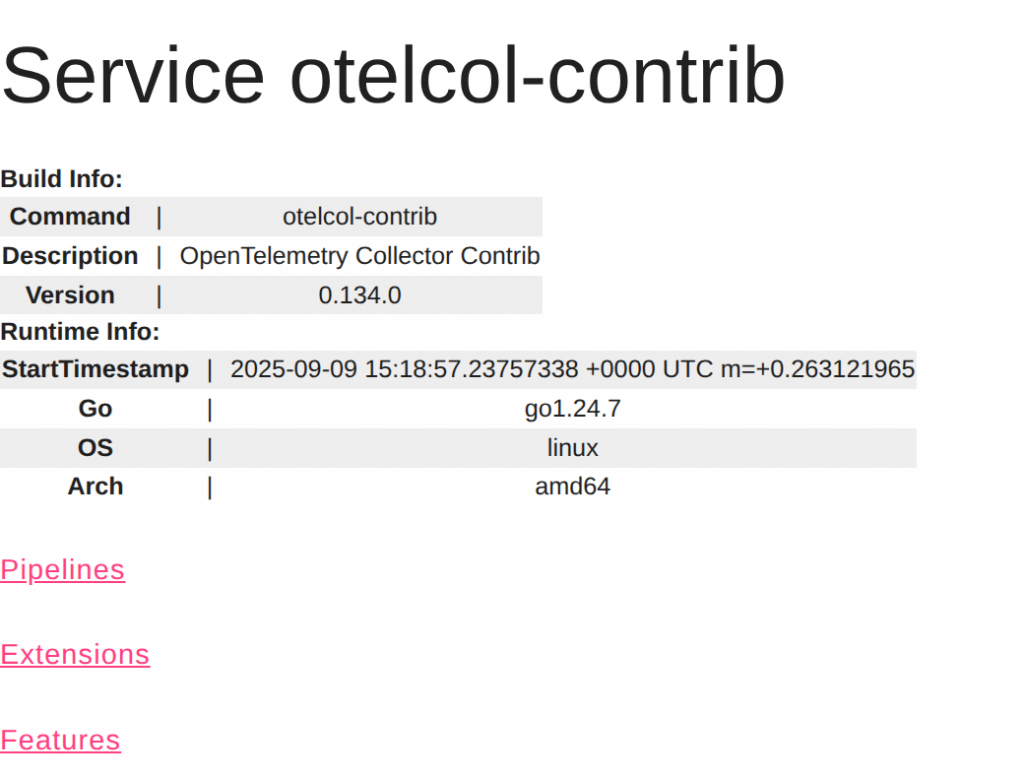
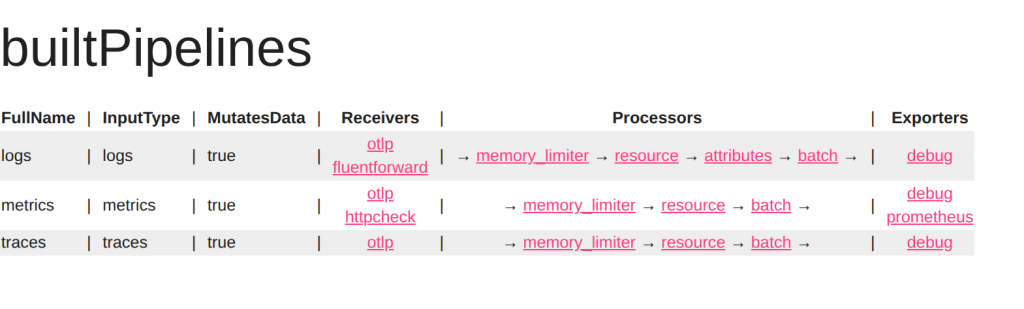
透過瀏覽器開啟 http://localhost:55679/debug/servicez
這是 zpags 擴充套件提供的。我們能從這畫面上看到目前 collector 的版本跟 pipeline 的配置情況。
或者
# 🎭 zPages 調試介面 - Collector 的透視鏡
open http://localhost:55679/debug/tracez

# 🔬 效能分析介面
open http://localhost:1777/debug/pprof/
今天先把基本的 openTelemetry collector 用 devspace 給啟動。
明天來把昨天的 fluentbit 的結果整合過來,並且我們能嘗試在 collector 中整合一些 k8s 的processor來玩看看。