我們的服務已經部署上線,但它是一個「黑盒子」。
它現在健康嗎?每秒處理多少請求?平均回應時間是多少?錯誤率有沒有突然飆升?
要回答這些問題,我們需要可觀測性(Observability)。
可觀測性通常建立在三大支柱之上:
本文將聚焦於「指標」,我們將使用 Prometheus 來收集指標,並用 Grafana 來將其視覺化。
我們將透過 docker-compose.yaml 來啟動 Prometheus 和 Grafana 服務。
建立 Prometheus 設定檔:在專案根目錄下建立 prometheus.yml。
# prometheus.yml
global:
  scrape_interval: 15s # 每 15 秒抓取一次指標

scrape_configs:
  - job_name: 'go-clean-project'
    static_configs:
      - targets: ['app:5001'] # 指向我們的 Go 應用程式容器
更新 docker-compose.yaml:
# docker-compose.yaml
services:
  # ... app, db, redis 服務 ...
  prometheus:
    image: prom/prometheus:v2.47.2
    container_name: go-clean-project-prometheus
    restart: always
    ports:
      - "9090:9090"
    volumes:
      - ./prometheus.yml:/etc/prometheus/prometheus.yml

  grafana:
    image: grafana/grafana:10.1.5
    container_name: go-clean-project-grafana
    restart: always
    ports:
      - "3000:3000"
/metrics 端點Prometheus 採用「拉(Pull)」模型,它會定期地從我們應用程式暴露的一個 HTTP 端點上抓取指標。這個端點通常是 /metrics。
安裝 Prometheus 客戶端函式庫:
go get github.com/prometheus/client_golang
註冊 /metrics 路由:在 internal/http/route.go 中,新增一個路由來提供 Prometheus 的 handler。
// internal/http/route.go
import "github.com/prometheus/client_golang/prometheus/promhttp"

func SetupRoutes(...) {
    // ...
    router.GET("/metrics", gin.WrapH(promhttp.Handler()))
    // ...
}
光有預設指標是不夠的,我們需要定義能反映我們業務狀況的自訂指標。最好的方式是透過一個中介軟體來完成。
在 internal/http/middleware/ 目錄下建立 metrics.go:
// internal/http/middleware/metrics.go
package middleware

import (
	"strconv"
	"time"

	"github.com/gin-gonic/gin"
	"github.com/prometheus/client_golang/prometheus"
	"github.com/prometheus/client_golang/prometheus/promauto"
)

var (
	httpRequestsTotal = promauto.NewCounterVec(
		prometheus.CounterOpts{
			Name: "http_requests_total",
			Help: "Total number of http requests.",
		},
		[]string{"method", "path", "status"}, // 標籤
	)

	httpRequestDuration = promauto.NewHistogramVec(
		prometheus.HistogramOpts{
			Name: "http_request_duration_seconds",
			Help: "Duration of http requests.",
		},
		[]string{"method", "path"},
	)
)

// Metrics 是一個收集請求指標的中介軟體
func Metrics() gin.HandlerFunc {
	return func(c *gin.Context) {
		startTime := time.Now()

		c.Next()

		duration := time.Since(startTime)
		path := c.FullPath() // 使用路由範本,避免維度爆炸
		method := c.Request.Method
		status := strconv.Itoa(c.Writer.Status())

		// 更新指標
		httpRequestDuration.WithLabelValues(method, path).Observe(duration.Seconds())
		httpRequestsTotal.WithLabelValues(method, path, status).Inc()
	}
}
最後,在 route.go 中註冊這個新的中介軟體:router.Use(Metrics())。
現在,我們的應用正在持續地暴露指標,Prometheus 也正在持續地抓取它們。我們需要 Grafana 來將這些數據變成直觀的圖表。
瀏覽 http://localhost:3000(預設帳號密碼 admin/admin)。進入 Connections -> Data sources,新增一個 Prometheus 資料來源,URL 設定為 http://prometheus:9090。
建立儀表板:建立一個新的儀表板(Dashboard),並新增一個面板(Panel)。
撰寫 PromQL 查詢:在面板的查詢編輯器中,你可以使用 PromQL(Prometheus Query Language)來查詢指標。
sum(rate(http_requests_total[5m]))
histogram_quantile(0.95, sum(rate(http_request_duration_seconds_bucket[5m])) by (le, path))
透過組合不同的查詢,你可以建立一個包含 QPS、延遲、錯誤率、CPU 使用率等關鍵指標的儀表板,讓你的服務健康狀況一目了然。
類似這樣 (示意)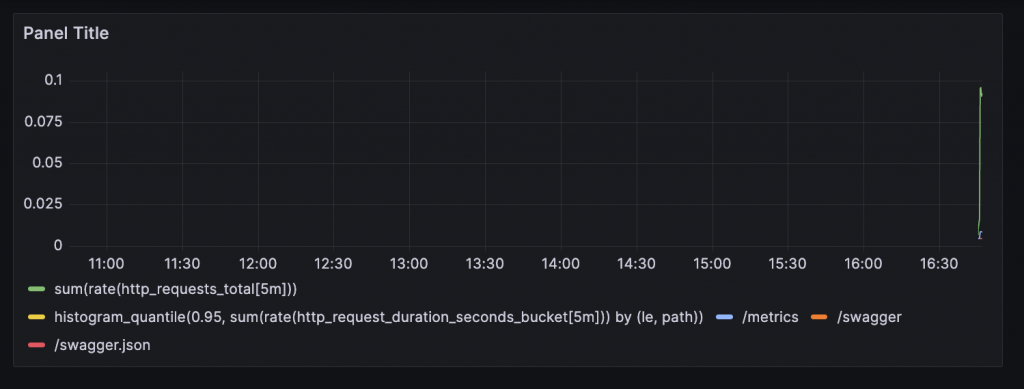
監控的最終目的是「告警」。你不可能 24 小時盯著儀表板。Prometheus 生態中的 Alertmanager 元件就是為此而生。其工作流程是:
API 錯誤率 > 5% 持續 5 分鐘)。設定 Alertmanager 較為複雜,但了解其在監控體系中的位置至關重要。
我們成功地為我們的 Go 服務加上了「眼睛」(Grafana 儀表板)和「耳朵」(Alertmanager 的基礎)。透過將應用程式的關鍵行為「指標化」,我們把一個黑盒子的服務,變成了一個可觀測、可度量的透明系統。這對於保障服務在生產環境的穩定運行,具有不可估量的價值。
詳細的程式碼,請參考 Github