如果覺得文章對你有所啟發,可以考慮用 🌟 支持 Gthulhu 專案,短期目標是集齊 300 個 🌟 藉此被 CNCF Landscape 採納 [ref]。
Perfetto 是由 Google 維護的專案,可以用於 System profiling 、 app tracing 以及 trace analysis。這對我們在分析排程器行為時非常有幫助。
將 Perfetto 編譯後,可以使用以下命令擷取系統的排程事件:
out/linux/tracebox -o out.perfetto-trace --txt -c test/configs/scheduling.cfg
它會在運作數秒後結束執行,並且將紀錄存放至 out.perfetto-trace。
接著,我們就可以打開 Perfetto 提供的 Trace Viewer 將檔案匯入:
我匯入的範例是在使用 stress-test 進行壓力測試時錄製的,因此,可以預期所有 CPU 都會被佔滿: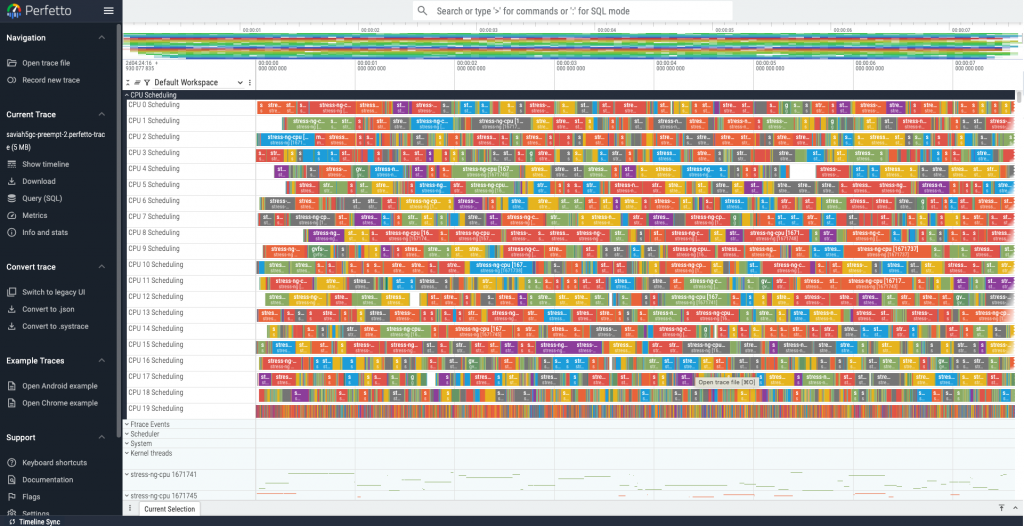
我們可以使用 W 與 S 在畫面上進行縮放: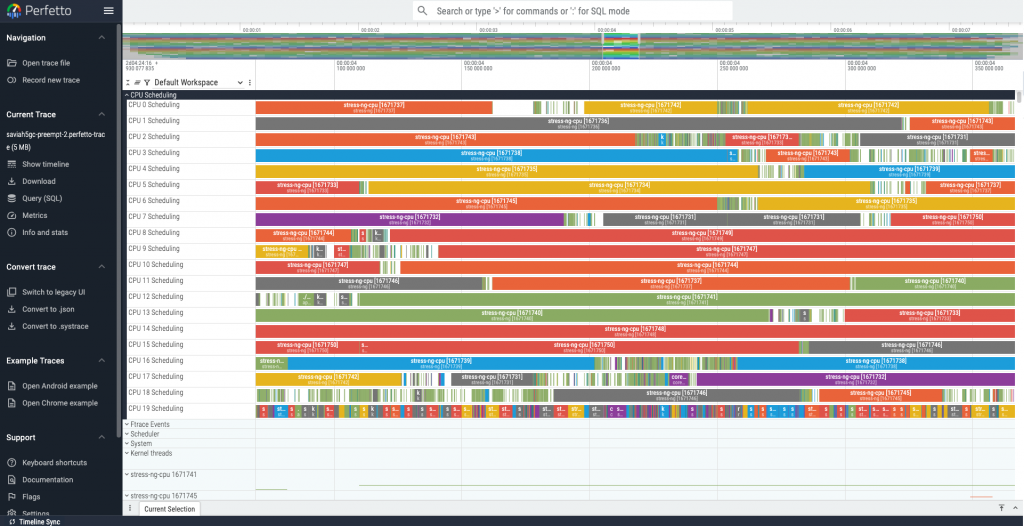
使用 A 與 D 在時間線上移動:
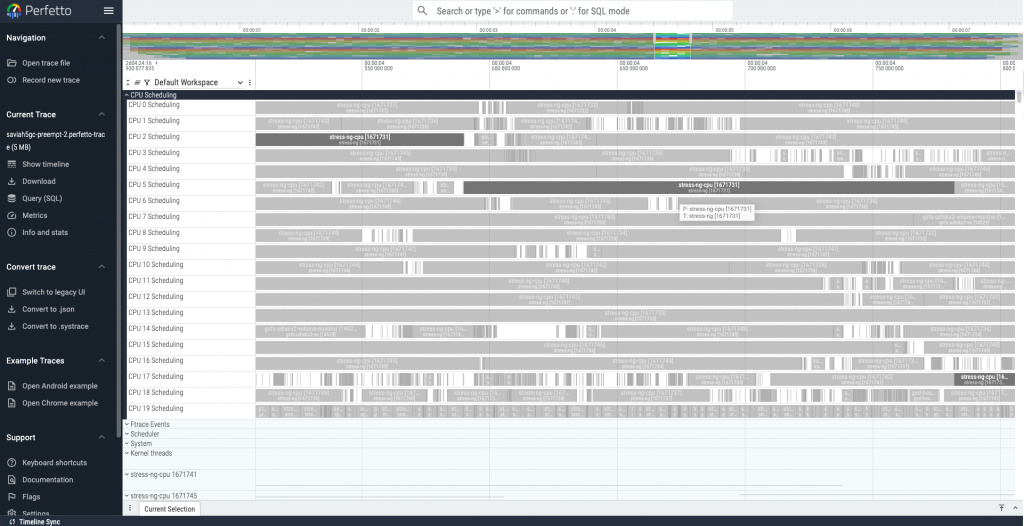
接著讓我們鎖定 UERANSIM 提供的 UE 模擬器 nr-ue 進行觀察:
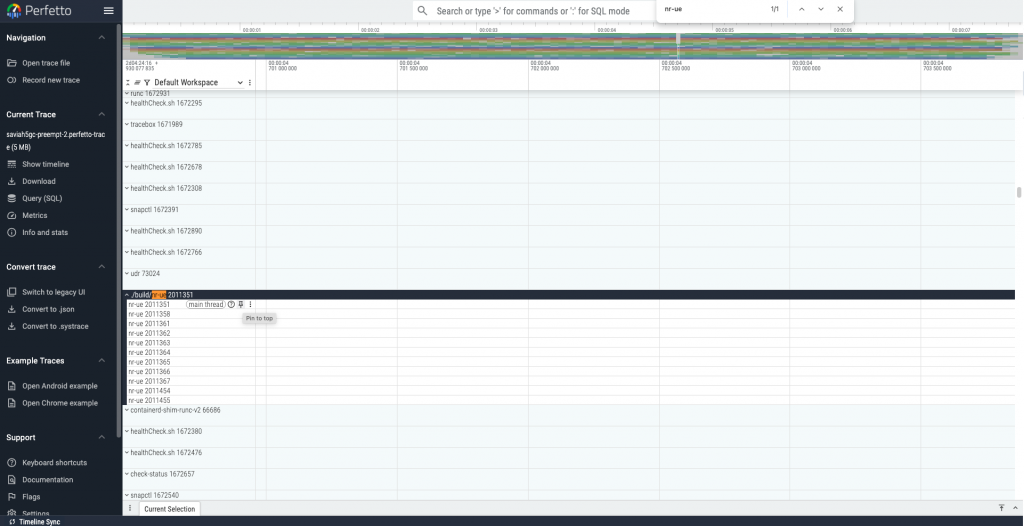
我們可以將 nr-ue 下的所有 thread 釘選,方便觀察 nr-ue 的行為:
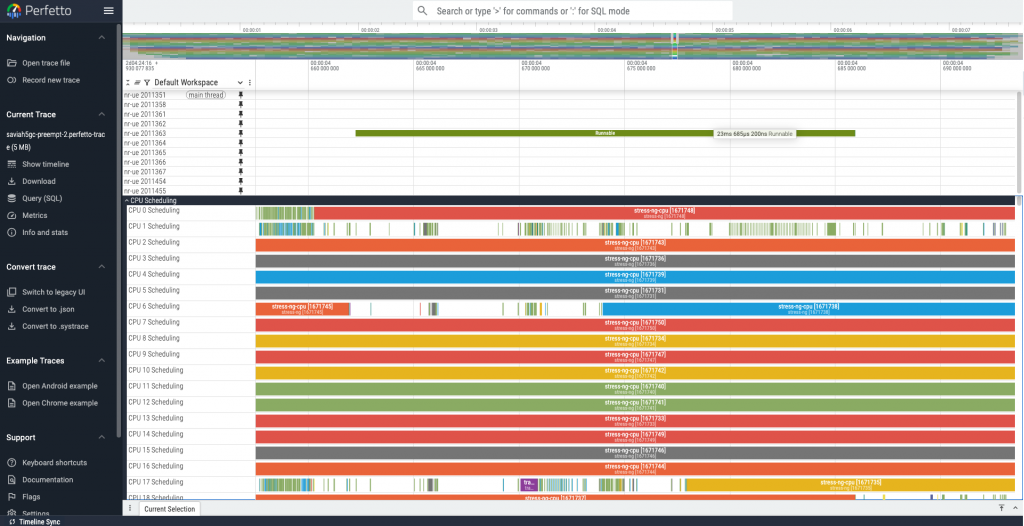
上方的圖片是當我快速的在時間線上移動,找到 nr-ue 被排程的足跡。我們可以發現該 thread 處於 RUNNABLE 的時間非常長,高達 23ms!
這也意味著因為排程器的關係,如果 nr-ue 這時候需要收送封包,其延遲至少就會再加上 23ms。
如果我們在對畫面進行放大,可以觀察 nr-ue 進入 RUNNING 後是因為什麼原因結束執行、被排程到哪一個 CPU 上: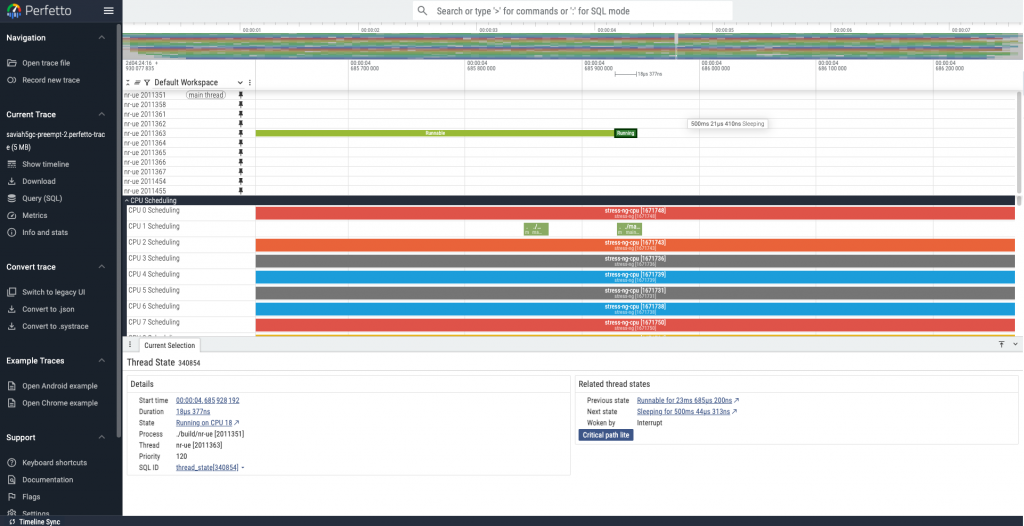
若上述的使用方式無法滿足分析需求,也可以利用 Trace Viewer 提供的 SQL 功能對資料快速查詢: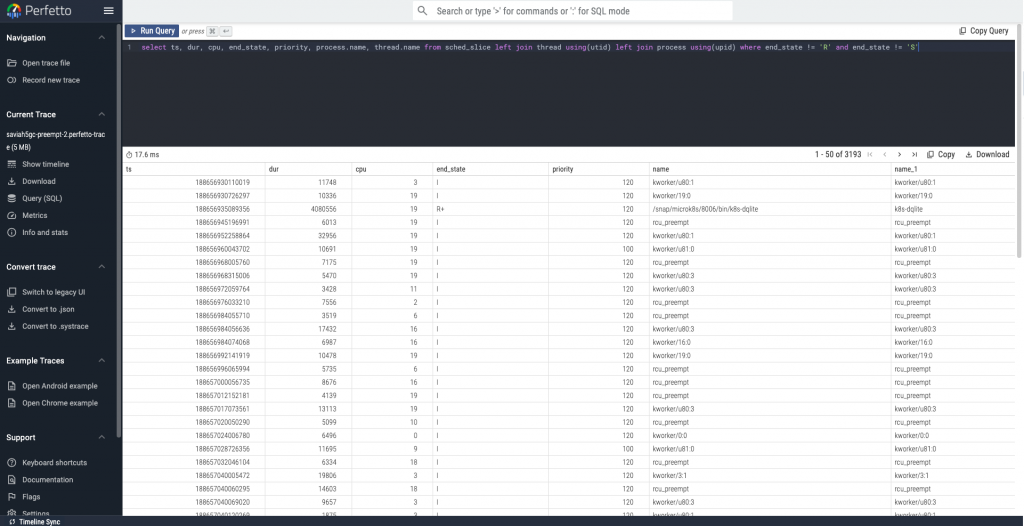
有了 Perfetto,我們就能觀察客製的排程器在運作時是否符合我們的預想。透過 Perfetto 我能馬上觀察目標 process 的 scheduling latency,以及前後任務的 end state,這對我嘗試降低 5G 核心網路的 latency 時也提供了非常大的幫助。
如果讀者想嘗試使用 Plugin 實作排程器,也可以使用 Perfetto 分析系統行爲唷。