
昨天(Day 22)我們建立了 Plugin 系統的地基:知道 Plugin 其實是 Chart.js 渲染引擎的核心骨架、學會三種安裝外掛的方式(Global/Per-chart/Inline)、也整理了完整的生命週期 Hook 對照表。今天要正式捲起袖子動手寫外掛:從最單純的背景色外掛開始暖身,接著實作兩個實務上很常用的外掛——浮水印(Watermark)與圖表正中央標籤(Center Text),最後深入搞懂外掛的
options該怎麼設計,才能讓同一個外掛在 Global(全域)與 Per-chart(單一圖表)兩種情境下,都能有各自獨立、互不干擾的設定。
在動手寫外掛之前,先快速複習外掛的骨架。一個 Chart.js 外掛本質上就是一個普通的 JavaScript 物件,最基本會包含兩個東西:
const myPlugin = {
  id: 'myPlugin', // 唯一識別碼,必填,之後設定 options 都靠這個 id 對應
  beforeDraw(chart, args, options) {
    // 在資料內容畫上去「之前」執行
  },
  afterDraw(chart, args, options) {
    // 在資料內容畫上去「之後」執行
  }
};
id:外掛的身分證字號,options.plugins.{id} 就是靠這個字串對應到外掛。同一份程式碼裡不能有兩個外掛共用同一個 id。beforeDraw / afterDraw:這兩個是今天最主要會用到的 Hook。畫面的視覺順序,就是 Hook 被呼叫的順序——beforeDraw 畫的東西會被資料蓋住(適合畫「背景」),afterDraw 畫的東西會蓋住資料(適合畫「疊加圖層」,例如浮水印、中央文字)。實務上很常見的需求:在報表、儀表板的圖表上加一個半透明的浮水印文字(例如公司名稱、「內部資料」、「僅供參考」),防止圖表被截圖後任意流傳,或單純標示資料來源。
const watermarkPlugin = {
  id: 'watermark',
  // 定義預設值:使用外掛的人如果沒有特別設定,就會套用這裡的值
  defaults: {
    text: 'Chart.js Demo',
    color: 'rgba(0, 0, 0, 0.08)',
    fontSize: 28,
    rotate: -20 // 文字旋轉角度(單位:度)
  },
  afterDraw(chart, args, options) {
    const { ctx, chartArea: { left, top, width, height } } = chart;
    const { text, color, fontSize, rotate } = options;

    ctx.save();
    // 將座標系原點移到圖表繪圖區正中央,方便用旋轉的方式畫出斜體浮水印
    ctx.translate(left + width / 2, top + height / 2);
    ctx.rotate((rotate * Math.PI) / 180);

    ctx.font = `bold ${fontSize}px 'Microsoft JhengHei', sans-serif`;
    ctx.fillStyle = color;
    ctx.textAlign = 'center';
    ctx.textBaseline = 'middle';
    ctx.fillText(text, 0, 0);

    ctx.restore(); // 還原座標系與樣式,避免影響到其他繪製流程
  }
};
程式碼重點說明:
defaults 屬性:這是外掛開發的慣例寫法,把「使用者沒有指定時的預設值」直接寫在外掛物件的 defaults 裡。Chart.js 在合併 options.plugins.{id} 時,會自動把 defaults 當作基礎值,使用者傳入的設定則會覆蓋對應的欄位(合併邏輯詳見第五節)。ctx.translate() + ctx.rotate():這是 Canvas 2D API 的標準做法——先把座標系原點移動到想要旋轉的中心點,再旋轉座標系,最後畫圖時直接以 (0, 0) 為基準,就能畫出「以圖表正中央為軸心旋轉」的斜體浮水印效果。ctx.save() / ctx.restore():這一組務必成對出現。因為 translate、rotate、fillStyle 這些設定都是全域套用在整個 Canvas Context 上的,如果沒有在畫完之後 restore() 還原,會影響到 Chart.js 接下來(或下一次重繪時)自己畫座標軸、圖例的位置與樣式。chart.chartArea:這是 Chart.js 提供的屬性,代表「扣掉座標軸、圖例、標題之後,實際繪製資料的矩形區域」座標。用 chartArea 而不是整個 chart.width / chart.height,可以讓浮水印精準置中在資料繪圖區,而不是整張 Canvas(包含座標軸文字)的正中央。Chart.register(watermarkPlugin); // 註冊成 Global Plugin,所有圖表預設都會套用
const chart = new Chart(ctx, {
type: 'line',
data,
options: {
plugins: {
watermark: {
text: '內部資料・僅供參考',
color: 'rgba(200, 0, 0, 0.1)'
}
}
}
});
畫面效果:圖表資料畫完之後,會在正中央疊加一行淡淡的、帶有旋轉角度的浮水印文字,不會擋住資料的可讀性,但截圖後可以清楚辨識來源。
甜甜圈圖(Doughnut Chart)最中間是一個空心圓,這塊空間常常被拿來顯示「總計數字」,例如「總營收:$120,000」或「完成率:78%」。這是 Chart.js 官方沒有內建、但業界極度常見的一個需求,很適合拿來練習寫外掛。
const centerTextPlugin = {
  id: 'centerText',
  defaults: {
    text: '', // 若未指定文字,預設會自動加總 dataset 的數值
    color: '#333',
    fontSize: 24,
    subText: '',
    subColor: '#888',
    subFontSize: 14
  },
  afterDraw(chart, args, options) {
    // 只在甜甜圈圖 / 圓餅圖套用,避免不小心套到長條圖等其他類型
    if (chart.config.type !== 'doughnut' && chart.config.type !== 'pie') return;

    const { ctx, chartArea: { left, top, width, height } } = chart;
    const centerX = left + width / 2;
    const centerY = top + height / 2;

    // 若沒有指定 text,自動加總第一個 dataset 的所有數值
    const mainText = options.text || chart.data.datasets[0].data
      .reduce((sum, value) => sum + value, 0)
      .toLocaleString();

    ctx.save();
    ctx.textAlign = 'center';
    ctx.textBaseline = 'middle';

    ctx.font = `bold ${options.fontSize}px 'Microsoft JhengHei', sans-serif`;
    ctx.fillStyle = options.color;
    // 有副標題時,主標題往上移一點,留出副標題的位置
    ctx.fillText(mainText, centerX, options.subText ? centerY - 12 : centerY);

    if (options.subText) {
      ctx.font = `${options.subFontSize}px 'Microsoft JhengHei', sans-serif`;
      ctx.fillStyle = options.subColor;
      ctx.fillText(options.subText, centerX, centerY + 14);
    }

    ctx.restore();
  }
};
程式碼重點說明:
if (chart.config.type !== 'doughnut' && ...) return;:由於這個外掛如果註冊成 Global Plugin,會套用到「所有」圖表,但中央標籤只對「空心」的甜甜圈圖/圓餅圖有意義,所以要主動判斷圖表類型,不符合就直接 return,避免在長條圖、折線圖上也莫名畫出文字。text 時,外掛會貼心地自動加總 datasets[0].data 當作預設顯示內容,這是提升外掛「開箱即用」體驗的常見手法——提供合理的預設行為,同時保留客製化的彈性。toLocaleString():將數字轉換為「千分位」格式(例如 120000 顯示為 120,000),是報表類需求很實用的小技巧。Chart.register(centerTextPlugin);
const chart = new Chart(ctx, {
type: 'doughnut',
data: {
labels: ['信用卡', '行動支付', '現金'],
datasets: [{ data: [45000, 32000, 18000] }]
},
options: {
plugins: {
centerText: {
subText: '本月總營收'
}
// 沒有指定 text,會自動顯示 45000 + 32000 + 18000 = 95,000
}
}
});
這是今天最重要的觀念:外掛的行為(程式邏輯)跟外掛的設定(options)是分開管理的,理解這兩者如何「合併」,才能靈活運用 Global Plugin。
當 Chart.js 準備呼叫一個外掛的 Hook 時,會依照下面的優先順序,把三層設定**合併(merge)**成最終的 options 參數傳給 Hook:
plugin.defaults(外掛內建預設值,優先權最低)
      ↓ 合併
Chart.defaults.plugins.{id}(透過 Chart.defaults 設定的全域預設值)
      ↓ 合併
chart.options.plugins.{id}(建立圖表當下傳入的 per-chart 設定,優先權最高)
也就是說,後面的設定會覆蓋前面的設定,而且是「淺層合併(浅層 merge,物件屬性逐一比對覆蓋)」,不是整個物件互相取代。實際範例:
// 外掛內部:defaults = { text: 'Demo', color: 'rgba(0,0,0,0.08)', fontSize: 28, rotate: -20 }

// 圖表 A:完全不設定,套用外掛內建預設值
new Chart(ctxA, { type: 'bar', data, options: {} });
// 最終 options = { text: 'Demo', color: 'rgba(0,0,0,0.08)', fontSize: 28, rotate: -20 }

// 圖表 B:只覆蓋 text 跟 color,其餘沿用預設值
new Chart(ctxB, {
  type: 'bar', data,
  options: { plugins: { watermark: { text: '機密文件', color: 'red' } } }
});
// 最終 options = { text: '機密文件', color: 'red', fontSize: 28, rotate: -20 }
圖表 B 只寫了 text 跟 color 兩個欄位,但 fontSize 跟 rotate 依然自動沿用外掛的 defaults——這就是「合併」而非「取代」的意義,也是為什麼建議把外掛的預設值定義在 defaults 裡,而不是在每次呼叫 Hook 時手動用 options.text || '預設文字' 這種寫法(雖然能達到類似效果,但沒辦法享受多圖表、多層次的合併機制)。
作用範圍:只要呼叫過 Chart.register(myPlugin),之後頁面上「所有」新建立的圖表,都會自動套用這個外掛(除非個別關閉)。但套用歸套用,每個圖表仍然可以有自己獨立的 options.plugins.{id} 設定,彼此不會互相影響:
Chart.register(watermarkPlugin);

// 圖表 1:業務部門儀表板
new Chart(ctx1, {
  type: 'line', data: salesData,
  options: { plugins: { watermark: { text: '業務部門' } } }
});

// 圖表 2:財務部門儀表板,同一份程式碼、同一個外掛,顯示不同文字
new Chart(ctx2, {
  type: 'bar', data: financeData,
  options: { plugins: { watermark: { text: '財務部門・機密' } } }
});
這正是 Global Plugin 搭配 options 設計的威力:外掛邏輯只寫一次,但透過 options 讓每張圖表都能有專屬的客製化內容,不需要為每個部門的儀表板複製貼上一份幾乎一樣的外掛程式碼。
如果某張圖表不想套用 Global Plugin(例如內部測試用的圖表不需要浮水印),直接把該外掛的設定設為 false 即可:
new Chart(ctxTest, {
  type: 'line', data,
  options: {
    plugins: {
      watermark: false, // 只關閉這張圖表的 watermark 外掛,其他圖表不受影響
      centerText: false
    }
  }
});
如果不同圖表需要的不只是「設定不同」,而是邏輯本身就不一樣(例如浮水印的畫法完全不同),這時就不適合用 Global Plugin + options 的方式硬凹,而應該回到 Day 22 介紹過的 Per-chart Plugin,各自傳入不同的外掛實作:
const chart1 = new Chart(ctx1, { type: 'line', data, plugins: [watermarkPluginV1] });
const chart2 = new Chart(ctx2, { type: 'bar', data, plugins: [watermarkPluginV2] });
| 情境 | 建議做法 |
|---|---|
| 多張圖表都要同一種效果,只是文字/顏色等參數不同 | Global Plugin + 各自的 options.plugins.{id} |
| 只有一張圖表需要這個效果,其他圖表完全不需要 | Per-chart Plugin(plugins: [plugin]),或 Global 搭配該圖表以外全部 false |
| 不同圖表需要的繪製邏輯本身就不同,不只是參數不同 | 拆成多個獨立的外掛物件,各自用 Per-chart 方式套用 |
| 只是想要臨時測試效果、不會重複使用 | Inline Plugin(直接寫在 plugins: [{...}] 裡) |
CSS 版面樣式內容如下:
body { font-family: 'Segoe UI', 'Microsoft JhengHei', sans-serif; max-width: 960px; margin: 40px auto; padding: 0 16px; }
h1 { font-size: 1.4rem; }
button { padding: 8px 16px; margin: 12px 8px 12px 0; cursor: pointer; }
.charts { display: flex; gap: 24px; flex-wrap: wrap; }
.chart-box { flex: 1 1 380px; position: relative; height: 380px; }
p.tip { color: #666; font-size: 0.9rem; }
HTML 版面內容如下:
<button id="toggleWatermarkBtn">切換左圖浮水印</button>
<div class="charts">
  <div class="chart-box"><canvas id="barChart"></canvas></div>
  <div class="chart-box"><canvas id="doughnutChart"></canvas></div>
</div>
<script src="https://cdn.jsdelivr.net/npm/chart.js@4.5.1"></script>
JavaScript 程式碼內容如下:
// 背景色外掛(beforeDraw):在資料內容畫上去「之前」先鋪好整張畫布的底色
const backgroundColorPlugin = {
  id: 'customBackground',
  defaults: { color: '#ffffff' },
  beforeDraw(chart, args, options) {
    const { ctx } = chart;
    ctx.save();
    ctx.globalCompositeOperation = 'destination-over';
    ctx.fillStyle = options.color;
    ctx.fillRect(0, 0, chart.width, chart.height);
    ctx.restore();
  }
};

// 浮水印外掛(afterDraw):在資料內容畫完之後,疊加一段可旋轉的半透明文字
const watermarkPlugin = {
  id: 'watermark',
  defaults: {
    text: 'Chart.js Demo',
    color: 'rgba(0, 0, 0, 0.08)',
    fontSize: 26,
    rotate: -20
  },
  afterDraw(chart, args, options) {
    if (options === false) return;
    const { ctx, chartArea: { left, top, width, height } } = chart;
    const { text, color, fontSize, rotate } = options;

    ctx.save();
    ctx.translate(left + width / 2, top + height / 2);
    ctx.rotate((rotate * Math.PI) / 180);
    ctx.font = `bold ${fontSize}px 'Microsoft JhengHei', sans-serif`;
    ctx.fillStyle = color;
    ctx.textAlign = 'center';
    ctx.textBaseline = 'middle';
    ctx.fillText(text, 0, 0);
    ctx.restore();
  }
};

// 圖表中央標籤外掛(afterDraw):只對甜甜圈圖/圓餅圖生效,顯示總計數字或自訂文字
const centerTextPlugin = {
  id: 'centerText',
  defaults: {
    text: '',
    color: '#333',
    fontSize: 24,
    subText: '',
    subColor: '#888',
    subFontSize: 14
  },
  afterDraw(chart, args, options) {
    if (chart.config.type !== 'doughnut' && chart.config.type !== 'pie') return;

    const { ctx, chartArea: { left, top, width, height } } = chart;
    const centerX = left + width / 2;
    const centerY = top + height / 2;

    const mainText = options.text || chart.data.datasets[0].data
      .reduce((sum, value) => sum + value, 0)
      .toLocaleString();

    ctx.save();
    ctx.textAlign = 'center';
    ctx.textBaseline = 'middle';

    ctx.font = `bold ${options.fontSize}px 'Microsoft JhengHei', sans-serif`;
    ctx.fillStyle = options.color;
    ctx.fillText(mainText, centerX, options.subText ? centerY - 12 : centerY);

    if (options.subText) {
      ctx.font = `${options.subFontSize}px 'Microsoft JhengHei', sans-serif`;
      ctx.fillStyle = options.subColor;
      ctx.fillText(options.subText, centerX, centerY + 14);
    }

    ctx.restore();
  }
};

// 三個外掛都註冊成 Global Plugin,所有圖表預設都會套用
Chart.register(backgroundColorPlugin, watermarkPlugin, centerTextPlugin);

// 圖表 1:業務部門長條圖
const barChart = new Chart(document.getElementById('barChart'), {
  type: 'bar',
  data: {
    labels: ['一月', '二月', '三月', '四月'],
    datasets: [{
      label: '銷售額(萬元)',
      data: [65, 59, 80, 81],
      backgroundColor: '#4bc0c0'
    }]
  },
  options: {
    responsive: true,
    maintainAspectRatio: false,
    plugins: {
      customBackground: { color: '#f7fbfb' },
      watermark: { text: '業務部門' }
      // 沒有設定 centerText,套用預設值即可(但因為型別不是 doughnut/pie,afterDraw 會直接 return)
    }
  }
});

// 圖表 2:財務部門甜甜圈圖
const doughnutChart = new Chart(document.getElementById('doughnutChart'), {
  type: 'doughnut',
  data: {
    labels: ['信用卡', '行動支付', '現金'],
    datasets: [{
      data: [45000, 32000, 18000],
      backgroundColor: ['#ff6384', '#36a2eb', '#ffce56']
    }]
  },
  options: {
    responsive: true,
    maintainAspectRatio: false,
    plugins: {
      customBackground: { color: '#fffaf5' },
      watermark: { text: '財務部門・機密', rotate: -15 },
      centerText: { subText: '本月總營收' }
    }
  }
});

// 動態切換左側長條圖的浮水印外掛,觀察 Global Plugin 也能個別關閉
let watermarkEnabled = true;
document.getElementById('toggleWatermarkBtn').addEventListener('click', () => {
  watermarkEnabled = !watermarkEnabled;
  barChart.options.plugins.watermark = watermarkEnabled ? { text: '業務部門' } : false;
  barChart.update();
});
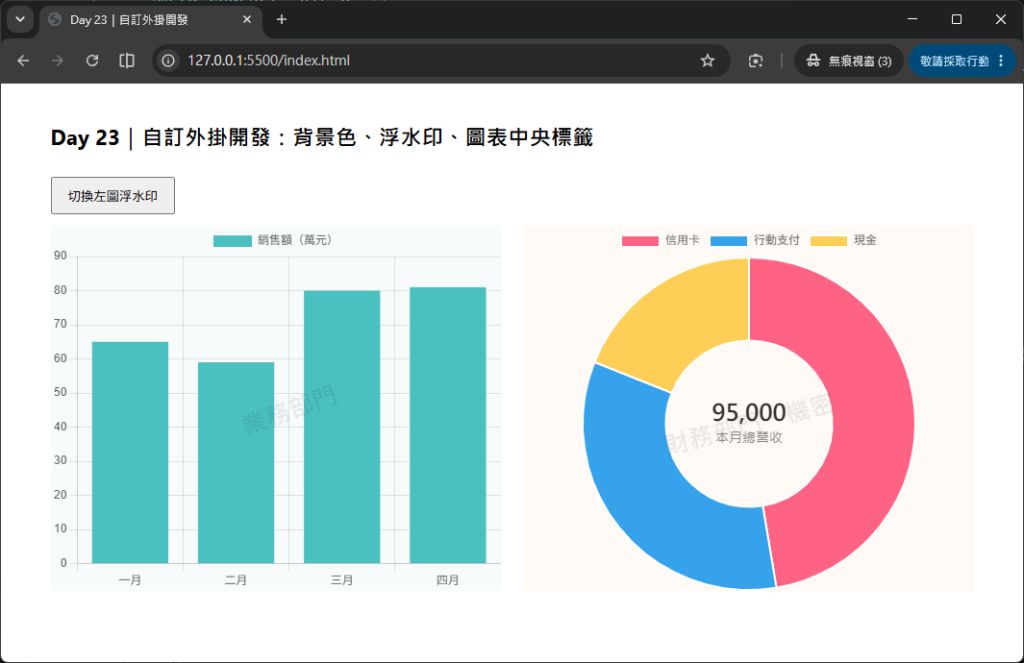
Chart.register() 註冊成 Global Plugin。options.plugins 設定不同的浮水印文字。centerTextPlugin 的 afterDraw 會自動偵測型別後直接 return,不會畫出任何內容。options.plugins.watermark 設成 false 再呼叫 chart.update(),觀察浮水印即時消失/出現。實際操作重點:打開 examples/example01/index.html,比對兩張圖表的浮水印文字是否確實不同、且互不影響;點擊切換按鈕後觀察 chart.update() 觸發重繪,浮水印是否正確地即時開關。
明天(Day 24)我們會把視角從「外掛」轉移到主題與樣式客製化:學習如何透過 Chart.defaults 一次設定所有圖表的全域預設樣式、打造深色模式(Dark Mode)與品牌色彩系統,並實作漸層色(Gradient)背景,讓圖表的視覺風格能夠更有系統地被管理,而不是每張圖表都重複寫一樣的樣式設定。



 iThome鐵人賽
 看影片追技術