
接下來就是見證奇蹟的時刻了,利用python code,把腳位輸出的訊號做成儀表板,就會如下圖的real time波形一樣,不斷的顯示在儀表板上,最小的MVP就已經完成。
import serial
import serial.tools.list_ports
import matplotlib.pyplot as plt
import matplotlib.animation as animation
from collections import deque
import threading
import time
import struct

# ================= 設定區 =================
COM_PORT = 'COM3'  # 請確認您的 Port
BAUD_RATE = 115200
# ==========================================

class FPGAMonitor:
    def __init__(self):
        self.running = True
        self.freq1 = 0
        self.freq2 = 0
        self.history_len = 50
        # 建立兩個歷史數據陣列
        self.data1_hist = deque([0]*self.history_len, maxlen=self.history_len)
        self.data2_hist = deque([0]*self.history_len, maxlen=self.history_len)
        self.time_hist = deque([0]*self.history_len, maxlen=self.history_len)
        self.start_time = time.time()
        self.packet_count = 0
        self.connection_status = "Disconnected"

    def connect_serial(self):
        try:
            self.ser = serial.Serial(COM_PORT, BAUD_RATE, timeout=1)
            self.connection_status = f"Connected: {COM_PORT}"
            print(f"✅ 連接成功: {COM_PORT}")
        except:
            print(f"❌ 無法連接 {COM_PORT}")

    def read_serial_loop(self):
        if not hasattr(self, 'ser') or not self.ser.is_open: return

        print("📡 等待雙通道數據...")
        while self.running:
            try:
                if self.ser.read(1) == b'\xAA':
                    # 讀取 9 bytes (4 byte Ch1 + 4 byte Ch2 + 1 byte Tail)
                    packet = self.ser.read(9)
                    if len(packet) == 9 and packet[8] == 0x55:
                        # 解析兩個整數 (>II 代表兩個 Big-Endian Unsigned Int)
                        val1, val2 = struct.unpack('>II', packet[0:8])

                        self.freq1 = val1
                        self.freq2 = val2
                        self.packet_count += 1

                        self.data1_hist.append(val1)
                        self.data2_hist.append(val2)
                        self.time_hist.append(time.time() - self.start_time)

                        print(f"[{self.packet_count}] Ch1: {val1:,} Hz | Ch2: {val2:,} Hz")
            except Exception as e:
                print(e)
                break

    def close(self):
        self.running = False
        if hasattr(self, 'ser'): self.ser.close()

def run_dashboard():
    monitor = FPGAMonitor()
    monitor.connect_serial()

    t = threading.Thread(target=monitor.read_serial_loop)
    t.daemon = True
    t.start()

    plt.style.use('dark_background')
    fig, (ax1, ax2) = plt.subplots(2, 1, figsize=(10, 8), sharex=True)
    plt.subplots_adjust(top=0.90, hspace=0.3)

    # 圖表 1: 複雜訊號
    line1, = ax1.plot([], [], color='#00ff00', lw=2) # 綠色
    ax1.set_title("Channel 1: Complex Signal (Pin 1)", color='#00ff00')
    ax1.set_ylabel("Freq (Hz)")
    text1 = ax1.text(0.95, 0.9, "", transform=ax1.transAxes, ha='right', color='#00ff00', fontsize=14, weight='bold')

    # 圖表 2: 10MHz 參考訊號
    line2, = ax2.plot([], [], color='#00ffff', lw=2) # 青色
    ax2.set_title("Channel 2: 10MHz Reference (Pin 2)", color='#00ffff')
    ax2.set_ylabel("Freq (Hz)")
    ax2.set_xlabel("Time (s)")
    text2 = ax2.text(0.95, 0.9, "", transform=ax2.transAxes, ha='right', color='#00ffff', fontsize=14, weight='bold')

    def init():
        line1.set_data([], [])
        line2.set_data([], [])
        return line1, line2

    def update(frame):
        x = list(monitor.time_hist)
        y1 = list(monitor.data1_hist)
        y2 = list(monitor.data2_hist)

        if x:
            # 更新 Ch1
            line1.set_data(x, y1)
            ax1.set_xlim(max(0, x[-1]-30), x[-1]+1)
            if y1: ax1.set_ylim(min(y1)*0.9, max(y1)*1.1)
            text1.set_text(f"{monitor.freq1:,} Hz")

            # 更新 Ch2
            line2.set_data(x, y2)
            if y2: ax2.set_ylim(min(y2)*0.999, max(y2)*1.001) # 範圍設緊一點看穩定度
            text2.set_text(f"{monitor.freq2:,} Hz")

        return line1, line2, text1, text2

    ani = animation.FuncAnimation(fig, update, init_func=init, interval=500)
    plt.show()
    monitor.close()

if __name__ == "__main__":
    run_dashboard()
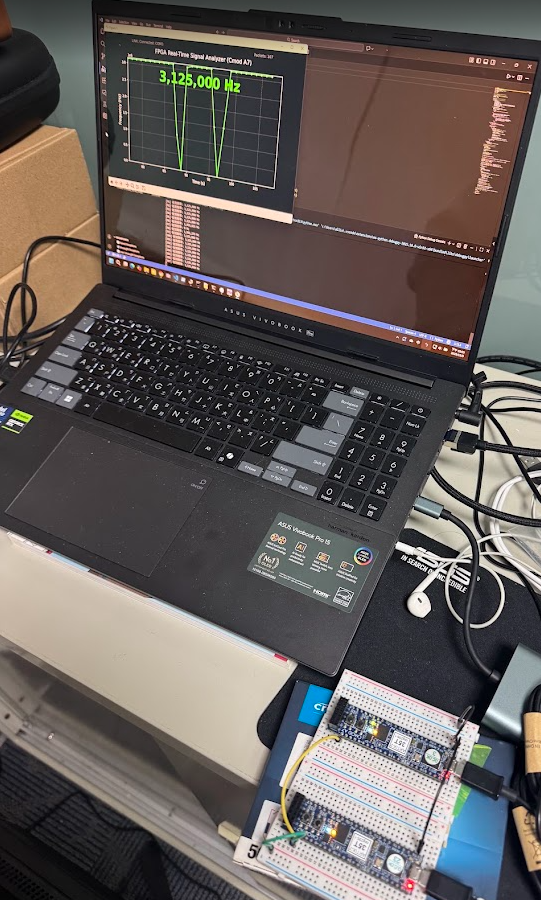
Figure 1:Python Dashboard



 iThome鐵人賽
 看影片追技術