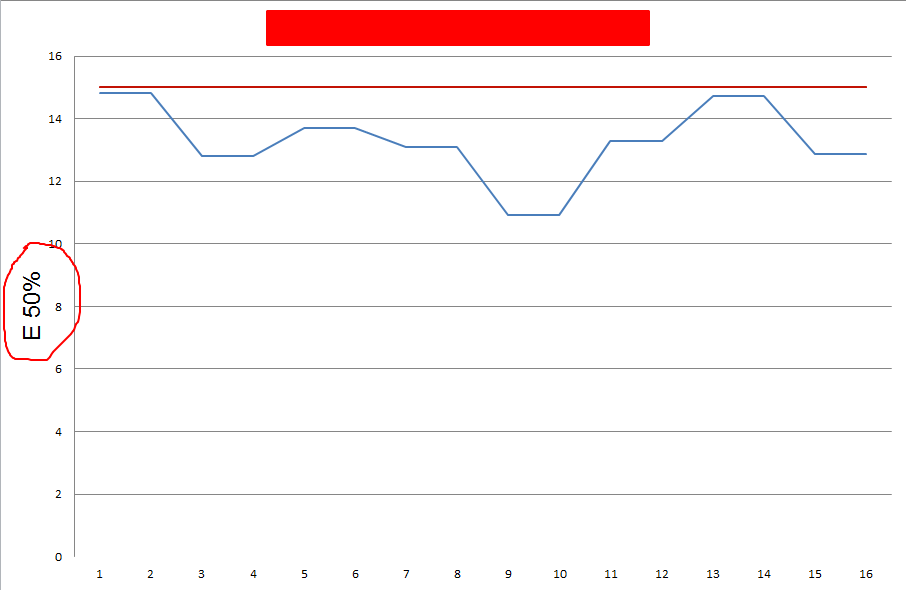
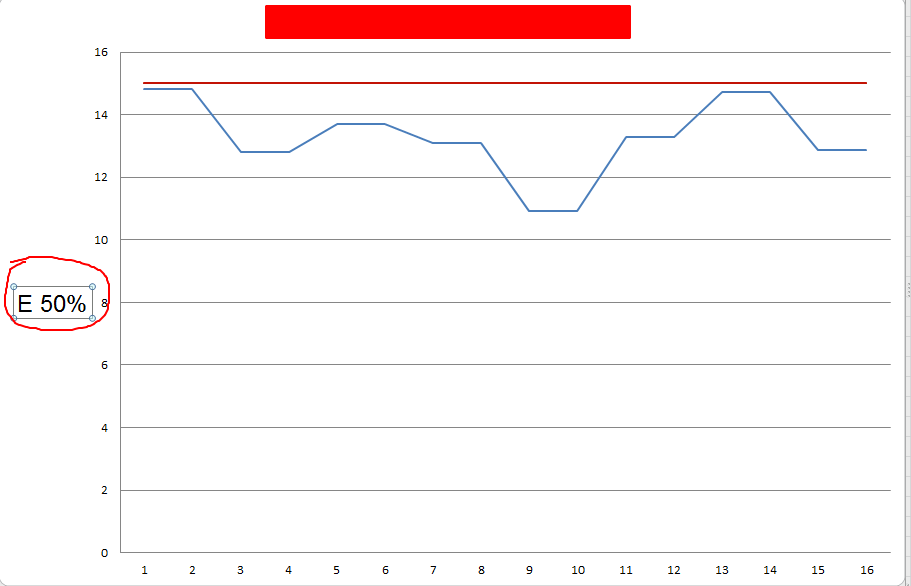
請問該如何設定PHPExcel 才能將 YAxisLabel 由垂直(圖一)改成水平(圖二)
圖一
圖二
    $dataseriesLabels = array(
        new PHPExcel_Chart_DataSeriesValues('String', "數據!\${$valueLabel}\$1", NULL, 1),  //Data1
        new PHPExcel_Chart_DataSeriesValues('String', "數據!\${$upLabel}\$1", NULL, 1),
        new PHPExcel_Chart_DataSeriesValues('String', "數據!\${$downLabel}\$1", NULL, 1),
    );
    $x = [];
    for ($i = 1; $i <= $dataCount; $i++) {
        $x[] = $i;
    }

    $xAxisTickValues = array(
        new PHPExcel_Chart_DataSeriesValues('String', NULL, NULL, $dataCount, $x), // 0~6
    );

    $dataSeriesValues = array(
        new PHPExcel_Chart_DataSeriesValues('Number', "數據!{$valueRange}", null, $dataCount, array(), 'none'),
        new PHPExcel_Chart_DataSeriesValues('Number', "數據!{$upRange}", null, $dataCount, array(), 'none', 'C21305'),
        new PHPExcel_Chart_DataSeriesValues('Number', "數據!{$downRange}", null, $dataCount, array(), 'none', 'C21305'),
    );

    $series = new PHPExcel_Chart_DataSeries(
        PHPExcel_Chart_DataSeries::TYPE_LINECHART,
        PHPExcel_Chart_DataSeries::GROUPING_STANDARD,    // plotGrouping
        range(0, count($dataSeriesValues) - 1),           // plotOrder
        $dataseriesLabels,                              // plotLabel
        $xAxisTickValues,                               // plotCategory
        $dataSeriesValues
    );
    $series->setLineWidth(1.5);
    $series->setPlotDirection(PHPExcel_Chart_DataSeries::DIRECTION_COL);

    $plotarea = new PHPExcel_Chart_PlotArea(null, array($series));

    $title = new PHPExcel_Chart_Title($title);
    $xAxisLabel = new PHPExcel_Chart_Title($xAxisLabel);
    //yAxisLabel 請問這裡該如何設定,才能改成水平?
    $layout = new PHPExcel_Chart_Layout();
    $yAxisLabel = new PHPExcel_Chart_Title($yAxisLabel, $layout);

    $yAxis = new PHPExcel_Chart_Axis();
    $yAxis->setAxisOptionsProperties('nextTo', null, null, null, null, null, $yAxisMinTick, $yAxisMaxTick, $yAxisInterval);

    $multiTypeChart = new PHPExcel_Chart($title, $title, null, $plotarea, true, 0, null, $yAxisLabel, null, $yAxis);

    $multiTypeChart->setTopLeftPosition($locLeft);
    $multiTypeChart->setBottomRightPosition($locBottom);
