PYTHON 想寫個天氣的爬蟲 請問資料要去哪邊撈
已邀請的邦友 {{ invite_list.length }}/5
感謝大神
收下學習了
前輩真的好強
有點借花獻佛的感覺,之前有幫解一個folium的題目順便學到如何用google map繪圖咩..
這邊強者真多 
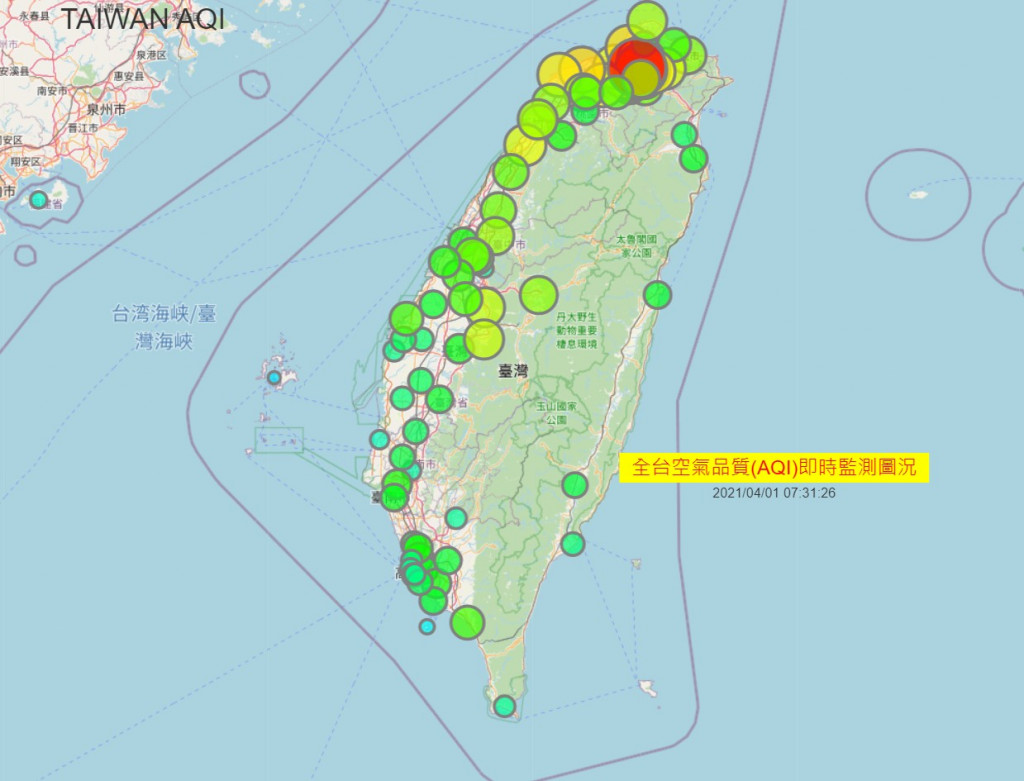
不過 我剛看一下這個好像是 pm2.5 不是 天氣 溫度 下雨或出太陽 這種的 我需要的是這種的說
是python寫的無誤,每10分鐘產生一次html靜態頁面,不過算不上真爬蟲,因為空氣品質資料是公開的格式(csv,json,xml)不用dom parser就能把資料分解開來
#!/usr/bin/env python3
# -*- coding:utf-8 -*-

import folium
import jsonpickle
import requests
import re
import os
import datetime
import colorsys
import math

ismain = False
testName = 'AQI'

#取得空品最大值與最小值轉換成相對色彩值
def colorWVB(From=[0,0,0],To=[360,100,100],r=0,min=0,max=30):
    #colorMin = colorsys.hsv_to_rgb(360,0,100)
    #colorMax = colorsys.hsv_to_rgb(272,100,43)
    sColor='white'
    cH = [From[0],To[0]]
    cS = [From[1],To[1]]
    cV = [From[2],To[2]]
    if max>min:
        vR = (r-min)/(max-min)
        sH = ((cH[-1]-cH[0])*vR+cH[0])/360
        sS = ((cS[-1]-cS[0])*vR+cS[0])/100
        sV = ((cV[-1]-cV[0])*vR+cV[0])/100
        rgb = colorsys.hsv_to_rgb(sH,sS,sV)
        sColor = "rgb({0},{1},{2})".format(int(rgb[0]*255),int(rgb[1]*255),int(rgb[2]*255))
    return sColor


#把空品質數轉換成RGB(數值愈高顏色愈深),我好像用錯色彩模型了
def color_producer(r,min=0,max=30):
    cn="white"
    cr=0.7
    vRange = max-min
    vDiff = vRange / 4
    if r<=min+vDiff :
        cn = colorWVB([360,0,100],[112,100,100],r,min,min+vDiff) #'green'
    elif r>min+vDiff and r<=min+vDiff*2:
        cn = colorWVB([112,100,100],[58,100,79],r,min+vDiff*1,min+vDiff*2) #'yellow'
    elif r>min+vDiff*2 and r<=min+vDiff*3:
        cn = colorWVB([58,100,79],[0,100,71],r,min+vDiff*2,min+vDiff*3) #'red'
    else:
        cn = colorWVB([0,100,71],[291,100,54],r,min+vDiff*3,min+vDiff*4) #'purple'
    return [cn,cr]


#以下為主程式
isdigit = re.compile(r'^\d+\.*\d*$')
localhtml = "taiwan.html"
pm25_url ='https://data.epa.gov.tw/api/v1/aqx_p_432?format=json&api_key=9be7b239-557b-4c10-9775-78cadfc555e9'
html = requests.get(pm25_url)
localtime = datetime.datetime.now().strftime('%Y/%m/%d %H:%M:%S')
json = jsonpickle.decode(html.text)
#把json檔變成python可用的diction/list
vMin = 999999
vMax = 0
for j in json['records']:
    pm2p5 = j[testName]
    if isdigit.match(pm2p5) is not None:
        vQ = int(pm2p5)
        if vQ < vMin :
            vMin = vQ
        if vQ > vMax :
            vMax = vQ


center = (23.5, 121)
# 動用到folium產生google map,把相對應的數值依GPS定位點繪製圓型跟套用色彩
m = folium.Map(location=center, zoom_start=8,title="全台空氣品質("+testName+")即時監測圖況")
folium.map.Marker(
    location=(23.2,121.4),
    icon=folium.DivIcon(
        icon_size=(300,36),
        icon_anchor=(0,0),
        html="<div style='text-align:center;font-size:1.6em;color:red;background-color:yellow;'>全台空氣品質("+testName+")即時監測圖況</div><div style='text-align:center;'>{0}</div>".format(localtime)),
    ).add_to(m)

fg = folium.FeatureGroup(name="PM2.5")
vLevel = (vMin if vMin>0 else 1)/(vMax if vMax>0 else 1)

for j in json['records']:
    pm2p5 = j[testName]
    if j["Latitude"]!= "" and j["Longitude"]!="" and isdigit.match(pm2p5) is not None:
        r = int(pm2p5)
        cc = color_producer(r,vMin,vMax)
        loc = (j["Latitude"],j["Longitude"])
        fg.add_child(folium.CircleMarker(
            location=loc,
            radius = r*vLevel,
            tooltip=str(r)+'\n'+j["SiteName"],
            fill_color=cc[0],
            color = 'grey',
            fill_opacity=cc[1]))
m.add_child(fg)


#把網頁存下來,並加一些meta符合facebook / line的分享資訊

currpath = "/var/www/html/"+localhtml
loc = 'TAIWAN '+testName
title_html = '<div style="z-index:5000;text-align:center;font-size:2.0em;background-color:transparent;position:fixed;top:0px;left:300px;">{}</div>'.format(loc)
m.get_root().html.add_child(folium.Element(title_html))
m.get_root().header.add_child(folium.Element('<meta property="og:title" content="全台空氣品質('+testName+')即時監測圖況" />'))
m.get_root().header.add_child(folium.Element('<meta property="og:type" content="article" />'))
m.get_root().header.add_child(folium.Element('<meta property="og:image" content="http://music.mihodb.com/taiwanpm25.jpg" />'))
m.get_root().header.add_child(folium.Element('<meta property="og:url" content="http://music.mihodb.com/taiwan.html" />'))
m.get_root().header.add_child(folium.Element('<meta property="og:description" content="資料來自: 行政院環境保護署。環境資源資料開放平臺 https://data.epa.gov.tw " />'))
m.save(currpath)

#就醬!
雄雄弄上來,草草寫註解,看了傷眼真的SORRY
不會唷 非常感謝 :)
不知我是不是用錯線性色彩模型HSV,抓出來的顏色似乎沒有我想的那麼美好,有興趣的人可以一起聊聊
強!
顏色變化這樣也許比較簡單:
如果是要同時改變 H 與其他數值
必須有經驗的視覺設計配出來才比較符合直覺
或是直接參考 https://env.healthinfo.tw/air/ 的配色
淺水員
謝啦,改起來好看多了,果然美學是天生的!
色彩模型這樣改起來簡單好區分
def color_producer(rin,minin=0,maxin=30):
    cr=0.7
    cn = colorWVB(From=[240,100,100],To=[0,100,100],r=rin,min=minin,max=maxin)
    return [cn,cr]