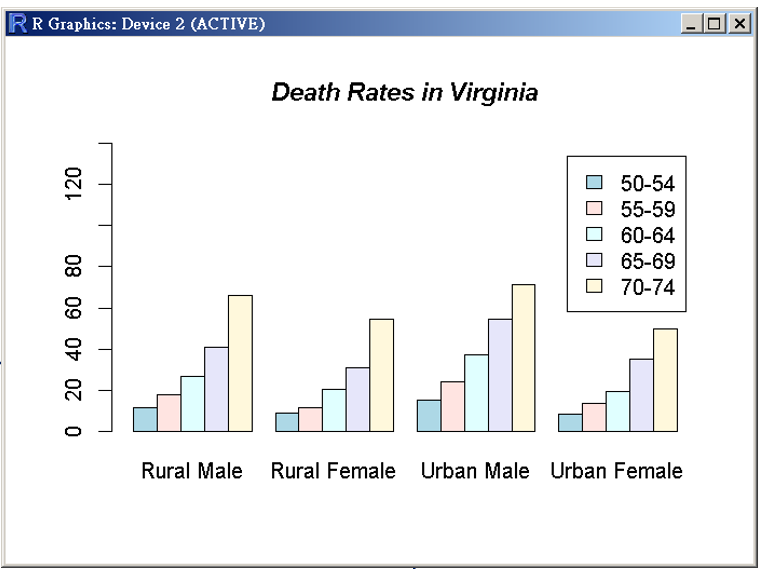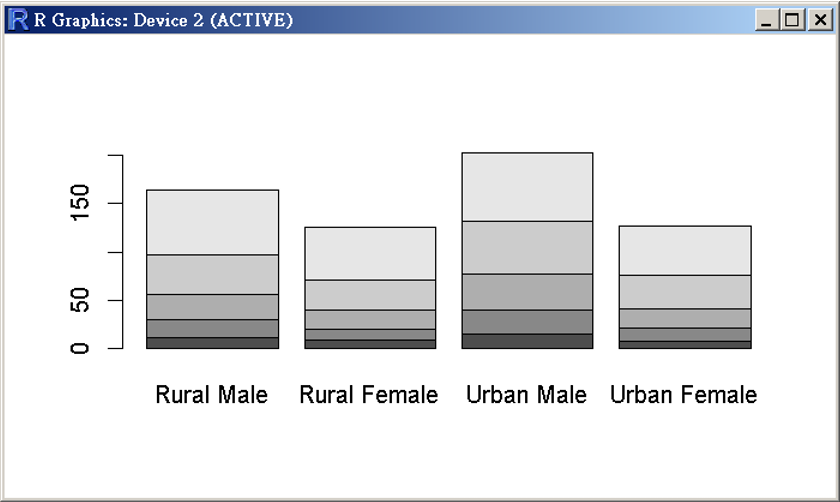
The data set is designed for story for the death rates in Virginia (1940). The death rates are measured per 1000 population per year. They are cross-classified by age group (each row in the above graph) and population group (each column in the above graph).
(a) Please draw the following two graphs
(b) What else you can analyze for the data set? Please suggest and do it.

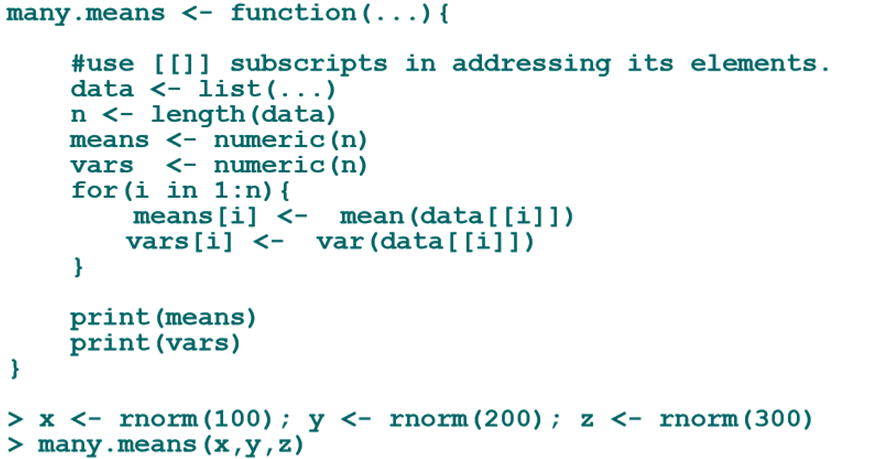
3. Here is a function that takes any number of vectors. Please interpret the meaning of the following codes in your own language. 

看起來樓主沒有自己思考過,單純只是要別人幫你做作業,這種作法不可取。
請樓主自己嘗試看看,你可以將你不懂得地方提出來問。
如果不想動腦,想要一整篇請別人幫忙的話,我建議你可以到TESKER出任務,花錢請人幫你寫。