我不投資科技股絕非迷信不迷信的問題,而是我對科技業並不具有獨到的眼光,因此我寧願投資我懂的東西。
巴菲特
今晚畫一下R3/R4/R5

自己看得圖,美觀不是第一要求,但目的,功能要有,且快速完成,不影響晚上睡眠及白天上班為主。
今天找上個月(2013/08),股票大於200元的個股。
這些公司,要變成where子句給財務分析數字用。
cpys=[]
for row in c.execute("SELECT * FROM m_prc_new WHERE mnp >200 and yr='102' and mon='8'"):
range(100))
    cpys.append(row[0])
where="','".join(cpys)
where="('"+where+"')"
print(where)

output:
('1476','2207','2227','2454','2357','3008','2059','2707','2727','2912','9921')
這裏用了join函數的技巧。
然後用土法煉鋼的方式,把之前寫死的code, 盡量用陣列,變數替代。
就是不知道要google什麼關鍵字,把SELECT SQL出來的資料,換成
畫圖的資料格式。
這個是核心,之後就可以快速轉資料格式了。
import datetime
import matplotlib.dates as md

R=7 #R01~R20指標
yrs=[92,93,94,95,96,97,98,99,100,101] #10年
x=[];y0=[0,0,0,0,0,0,0,0,0,0];y1=[0,0,0,0,0,0,0,0,0,0];y2=[0,0,0,0,0,0,0,0,0,0];
y3=[0,0,0,0,0,0,0,0,0,0];y4=[0,0,0,0,0,0,0,0,0,0];y5=[0,0,0,0,0,0,0,0,0,0];y6=[0,0,0,0,0,0,0,0,0,0];
y7=[0,0,0,0,0,0,0,0,0,0];y8=[0,0,0,0,0,0,0,0,0,0];y9=[0,0,0,0,0,0,0,0,0,0];yA=[0,0,0,0,0,0,0,0,0,0];
yB=[0,0,0,0,0,0,0,0,0,0] #x放年,y放各年的財務分析數字
where="','".join(cpys) #公司別
where="('"+where+"')"
ssql="SELECT * FROM fny where yr >=92 and cpyid in "+where+" order by 1,2"
for row in c.execute(ssql):   #每一列
    #print(row)
    for k in range(0,10):
        if row[0]==yrs[k]:   #每一年
            if row[1]==cpys[0]: #每一家公司
                y=int(row[0]+1911) #把年月日轉成數字
                dt=datetime.datetime(y,12,31)
                x.append(md.date2num(dt))
                y0[k]=(row[R])    #把財務指標放進陣列裏
            if row[1]==cpys[1]:
                y1[k]=(row[R])
            if row[1]==cpys[2]:
                y2[k]=(row[R])
            if row[1]==cpys[3]:
                y3[k]=(row[R])
            if row[1]==cpys[4]:
                y4[k]=(row[R])
            if row[1]==cpys[5]:
                y5[k]=(row[R])
            if row[1]==cpys[6]:
                y6[k]=(row[R])
            if row[1]==cpys[7]:
                y7[k]=(row[R])
            if row[1]==cpys[8]:
                y8[k]=(row[R])
            if row[1]==cpys[9]:
                y9[k]=(row[R])
            if row[1]==cpys[10]:
                yA[k]=(row[R])


x,y0,y1,y2,y3,y4,y5,y6,y7,y8,y9,yA
------------------------------
([731580.0,
  731946.0,
  732311.0,
  732676.0,
  733041.0,
  733407.0,
  733772.0,
  734137.0,
  734502.0,
  734868.0],
 [17.24, 24.96, 25.6, 29.76, 33.56, 14.7, 131.96, 209.22, 164.52, 1046.96],
 [28.2, 31.99, 41.18, 61.05, 122.65, 137.01, 313.34, 380.17, 295.38, 39.1],
 [0, 860.0, 0.0, 1138.97, 932.93, 347.25, 195.74, 2650.92, 3871.29, 3134.11],
 [377480.27, 0.0, 0.0, 0.0, 0.0, 0.0, 0.0, 0.0, 3086.44, 9491.12],
------------------------------------------
這個寫法,雖然很遜,不過之後筆者只要換R財務指標,就可以,其他部分都不用更動。
再來,畫圖。
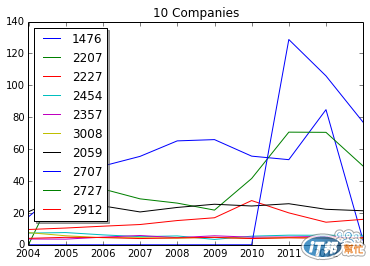
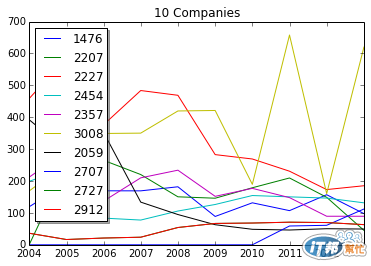
import matplotlib.pylab as plt

plt.figure()
ax=plt.gca()
ax.set_title('10 Companies')
ax.plot_date(x, y1, '-', label=cpys[0])
ax.plot_date(x, y2, '-', label=cpys[1])
ax.plot_date(x, y3, '-', label=cpys[2])
ax.plot_date(x, y4, '-', label=cpys[3])
ax.plot_date(x, y5, '-', label=cpys[4])
ax.plot_date(x, y6, '-', label=cpys[5])
ax.plot_date(x, y7, '-', label=cpys[6])
ax.plot_date(x, y8, '-', label=cpys[7])
ax.plot_date(x, y9, '-', label=cpys[8])
ax.plot_date(x, yA, '-', label=cpys[9])
#plt.autofmt_xdate()

legend = ax.legend(loc='upper left', shadow=True)
plt.show()

