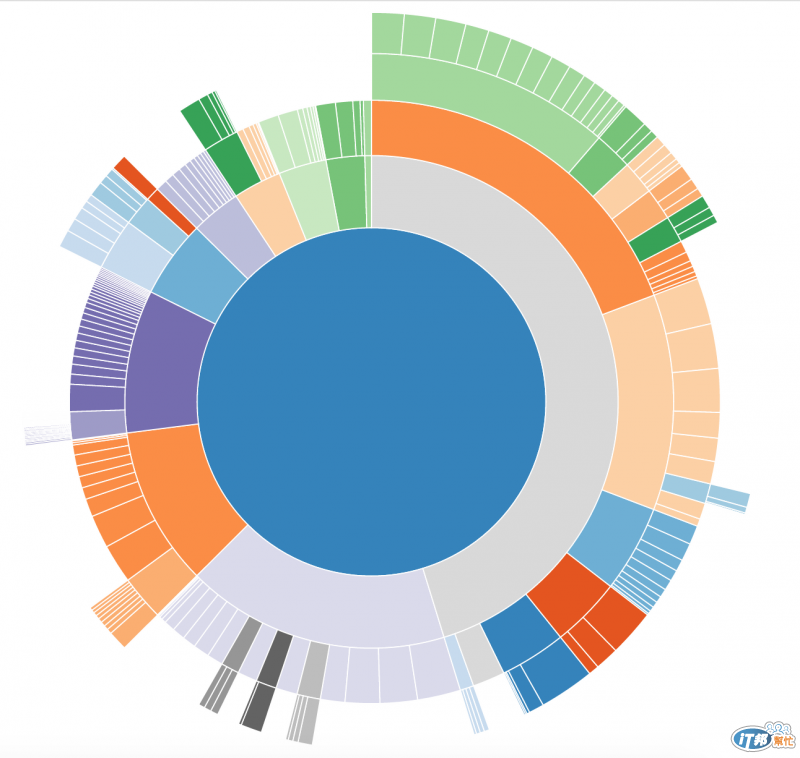
完整範例:http://wcc723.github.io/d3js/2014/10/27/Ironman-30-days-28/
看到KP API裡面有提供競選經費查詢,如果之前把資料撈回來,很難了解支出收入的關係,而且在支出與收入之中,何者比例較高。
參考:http://bl.ocks.org/mbostock/4348373
透過這張圖,雖然沒有數值可以了解精確的關係,但可以透過視覺快速比較彼此之間的概略比率,這也是d3.js內建的layout之一,且在這頁面上可以看到完整的程式碼,只要套用就可以了。

不過在套用前,要先轉換json的格式,昨天的文章對此有介紹,所以對d3js結構轉換可參考casper/d3js/2014/10/26/Ironman-30-days-27/。
詳細競選經費,還是以柯文哲官網提供為主
資料來源一樣是透過KP的API,只要資料結構轉換完,可以很輕鬆的套用各種d3.js layout範例。另外,在這個範例中整個圓並不是代表總金額,而只是支出與收入的比較圖。

kpPath = 'http://api.kptaipei.tw/v1/financial/all'

// 將nest資料改成name, children
function reSortRoot(root,value_key) {

    for (var key in root) {
      if (key == "key") {
        root.name = root.key;
        delete root.key;
      }
      if (key == "values") {
        root.children = [];
        for (item in root.values) {
          root.children.push(reSortRoot(root.values[item],value_key));
        }
        delete root.values;
      }
      if (key == value_key) {
        root.value = parseFloat(root[value_key]);
        delete root[value_key];
      }
    }
    return root;
  }
// 將nest資料改成name, children

d3.json(kpPath, function(d){ //透過KP API撈資料
  dataset = d.data;

  var nodesByType = d3.nest() //匯入資料轉成巢狀
    .key(function(d) { return d.type; })
    .key(function(d) { return d.account; })
    .entries(dataset); //匯入KP資料

  var root = {}; //定義一個空的物件


  root.key = "Data"; //定義物件名稱
  root.values = nodesByType; //以及物件來源

  //將json的key轉成name, children
  root = reSortRoot(root,"KpData");

  console.log(root)
  runChart(root) //資料轉完後就來開始畫圖
});


function runChart(root){ //畫圖 <--主要插入資料位置
  var width = 660,
    height = 500,
    radius = Math.min(width, height) / 2; //定義圓的大小

  var x = d3.scale.linear() //建立尺度
      .range([0, 2 * Math.PI]); //圓周率是也

  var y = d3.scale.sqrt() //尺度,開平方根,這真的太難了
      .range([0, radius]); //

  var color = d3.scale.category20c(); //載入d3.js 內建顏色

  var svg = d3.select(".demo").append("svg") //圖形繪製的位置及大小
      .attr("width", width)
      .attr("height", height)
    .append("g")
      .attr("transform", "translate(" + width / 2 + "," + (height / 2 + 10) + ")");

  var partition = d3.layout.partition() // 建立d3.js partition layout
      .value(function(d) { return d.price; }); //資料值來源為 Price(金額)

  var arc = d3.svg.arc() //建立弧形元件
      .startAngle(function(d) { return Math.max(0, Math.min(2 * Math.PI, x(d.x))); })
      .endAngle(function(d) { return Math.max(0, Math.min(2 * Math.PI, x(d.x + d.dx))); })
      .innerRadius(function(d) { return Math.max(0, y(d.y)); })
      .outerRadius(function(d) { return Math.max(0, y(d.y + d.dy)); });

  var path = svg.selectAll("path") //繪製path
      .data(partition.nodes(root)) //匯入資料 <-- 主要插入資料位置
      .enter().append("path") //用資料去跑
      .attr("d", arc)
      .style("fill", function(d) { return color((d.children ? d : d.parent).name); }) //
      .on("click", click); //點擊事件

    function click(d) {
      path.transition()
        .duration(750) //轉場效果
        .attrTween("d", arcTween(d)); //當點擊時執行縮放
    }

  d3.select(self.frameElement).style("height", height + "px");

  // 縮放事件
  function arcTween(d) {
    var xd = d3.interpolate(x.domain(), [d.x, d.x + d.dx]),
        yd = d3.interpolate(y.domain(), [d.y, 1]),
        yr = d3.interpolate(y.range(), [d.y ? 20 : 0, radius]);
    return function(d, i) {
      return i
          ? function(t) { return arc(d); }
          : function(t) { x.domain(xd(t)); y.domain(yd(t)).range(yr(t)); return arc(d); };
    };
  }

  //滑鼠滑入事件
  svg.selectAll("path").on('mouseover', function(d){
    mousePos = d3.mouse(this); //取得座標
    var xPos = mousePos[0] + radius; //修正座標
    var yPos = mousePos[1] + radius; //修正座標

    d3.select('#tooltip') //顯示資料
      .style({
        'left': xPos + 'px',
        'top': yPos + 'px'
      })
      .classed('hidden', false) //切換Class
    d3.select('#tooltip .account').html(d.account) //顯示資料
    d3.select('#tooltip .type').html((d.children ? d : d.parent).name)
    d3.select('#tooltip .price').html('$ ' + d.value)
  }).on('mouseout', function(d){ //滑鼠移出
    d3.select('#tooltip').classed('hidden', true) //切換Class,隱藏tooltip
  });
}
大略看一下柯文哲的支出收入,目前還沒有結束,收入部分主要是來自於個人捐贈以及網路捐贈,而支出部分主要是在人事以及宣傳上。
做完柯P財務報表,也會做看看連阿文的了...,不知道收入主要來源是不是爸爸。
