資料也可以直接從 database撈取
Zabbix database Model
https://share.zabbix.com/databases/mysql/zabbix-database-model
以下用python連sql,當然也可以直接到sql搜尋
import mysql.connector
from mysql.connector import errorcode
連線
config = {
  'host':'172.16.1.1',
  'user':'zabbix',
  'password':'zabbix',
  'database':'zabbix'
}
與API相同,先找hostid => itemid 再取item內的 data
SELECT * FROM zabbix.hosts;
用hostid找itemid
SELECT *
FROM zabbix.items
where hostid = '11005';
select itemid時間內的資料,時間要轉換成UNIX TIME
  cursor.execute("select * from history where clock > '1513675000' and itemid = '39762';")
  rows = cursor.fetchall()
  print("Read",cursor.rowcount,"row(s) of data.")

  # Print all rows
  for row in rows:
    print("Data row = (%s, %s, %s)" %(str(row[0]), str(row[1]), str(row[2])))
輸出
Connection established
('Read', 45, 'row(s) of data.')
Data row = (39762, 1513675002, 0.0019)
Data row = (39762, 1513675017, 0.0026)
Data row = (39762, 1513675032, 0.0069)
...
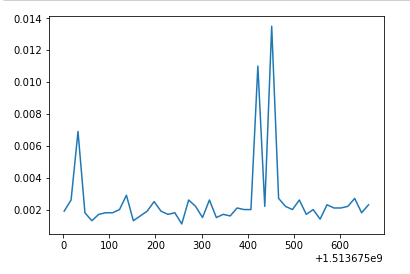
把row data放到pandas繪圖
import pandas as pd
import numpy as np
import matplotlib.pyplot as plt
newrows = np.array(rows)
x = newrows[:,1]
y = newrows[:,2]
plt.plot(x,y)
plt.show()
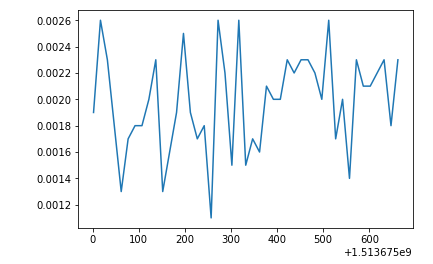
做些應用 Ex.修改極端值
df = pd.DataFrame(rows,columns=['itemid','clock','value','ns'])
data = df.replace([df[df['value'] > df['value'].quantile(0.8)].value],df['value'].quantile(0.75))


 iThome鐵人賽