在Ethereum-1節點上建置監控介面系統,並且安裝相關套件:
$ git clone https://github.com/cubedro/eth-netstats
$ cd eth-netstats
$ npm install
$ sudo npm install -g grunt-cli
$ grunt
$ npm start
在所有節點上安裝回報該節點狀態套件:
$ git clone https://github.com/cubedro/eth-net-intelligence-api
$ cd eth-net-intelligence-api
$ npm install
$ sudo npm install -g pm2
編輯 app.json 內參數:
[
  {
    "name"              : "node-app",
    "script"            : "app.js",
    "log_date_format"   : "YYYY-MM-DD HH:mm Z",
    "merge_logs"        : false,
    "watch"             : false,
    "max_restarts"      : 10,
    "exec_interpreter"  : "node",
    "exec_mode"         : "fork_mode",
    "env":
    {
      "NODE_ENV"        : "production",
      "RPC_HOST"        : "10.28.120.32",
      "RPC_PORT"        : "8545",
      "LISTENING_PORT"  : "30303",
      "INSTANCE_NAME"   : "node-1",
      "CONTACT_DETAILS" : "",
      "WS_SERVER"       : "http://10.28.120.32:3000",
      "WS_SECRET"       : "77777",
      "VERBOSITY"       : 2
    }
  }
]
這裡需要更改
RPC_HOST為節點的 IP address,INSTANCE_NAME為節點在監控介面上的名稱,WS_SERVER為建置監控環境的 IP address 與 port,WS_SECRET為串接節點所設定的 networkid
啟動回報狀態至監控介面:
$ pm2 start processes.json
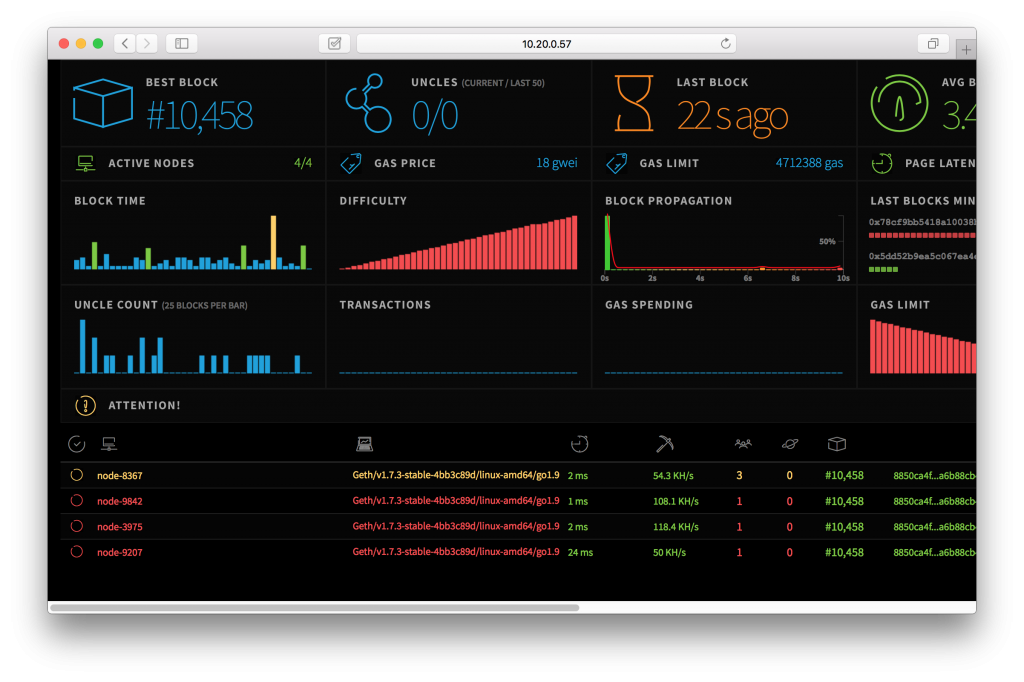
使用瀏覽器輸入 http://10.28.120.32:3000 進入監控介面: