我自己是工程師,所以當公司有不同需求時,大部分的時候我都能靠程式實作去完成任務,但是有些時候資料更新是連續的,每次業務或行銷團隊有需要時,如果每次都找你幫忙解析資料,那還真是一件麻煩的事情,所以這幾天的介紹中,我會講講shiny ,這套將資料變成網頁的一個工具。
首先是安裝並使用
install.packages("shiny")
library(shiny)
第一次使用當然就先用官方樣板來開局。
runExample("01_hello")
這時候會跳出一個新的視窗。
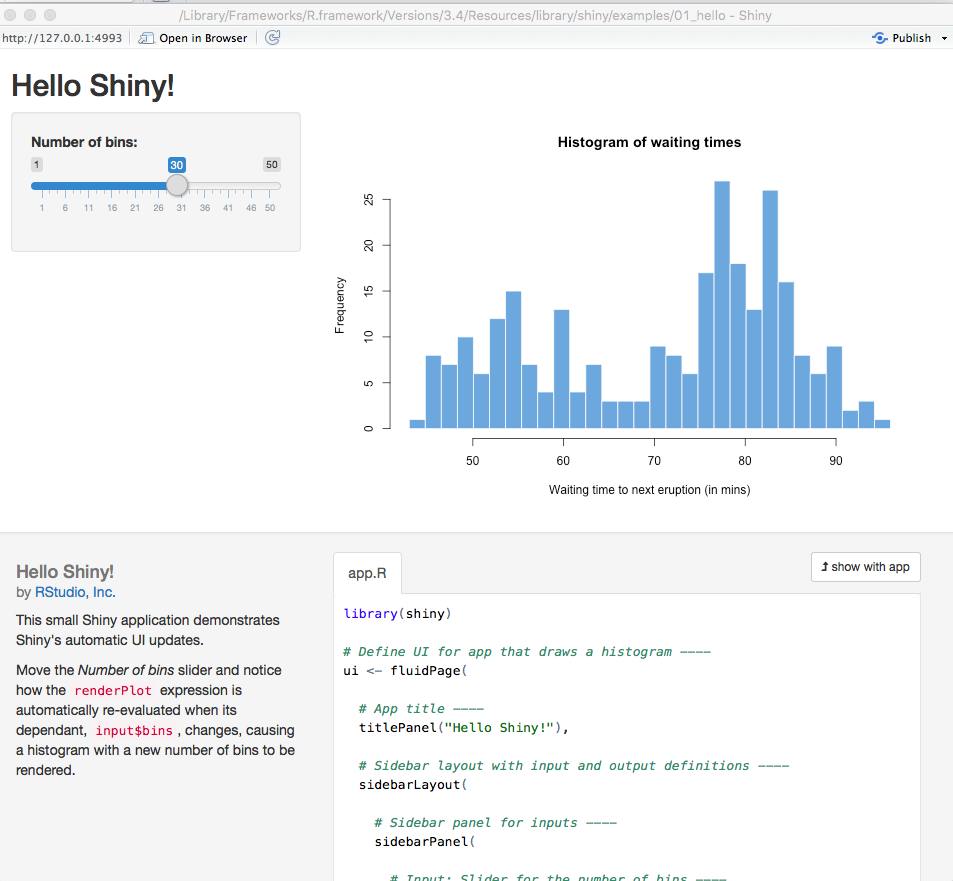
很特別的是shiny 所產生的頁面是可以互動的,左上方的Number of bins 是可以拉動的,而下方附上的是sample 的程式碼,底下讓我們來討論shiny 的架構。
Shiny主要由兩部分的程式碼組成,一個是ui ,顧名思義就是掌管畫面的配置,像是標題用titlePanel,sidebarLayout 就是側邊欄區塊,在這區塊放置用來滑動的sliderInput,mainPanel 則是負責圖表的顯示,我們在裡面畫出output 。
# Define UI for app that draws a histogram ----
ui <- fluidPage(

  # App title ----
  titlePanel("Hello Shiny!"),

  # Sidebar layout with input and output definitions ----
  sidebarLayout(

    # Sidebar panel for inputs ----
    sidebarPanel(

      # Input: Slider for the number of bins ----
      sliderInput(inputId = "bins",
                  label = "Number of bins:",
                  min = 1,
                  max = 50,
                  value = 30)

    ),

    # Main panel for displaying outputs ----
    mainPanel(

      # Output: Histogram ----
      plotOutput(outputId = "distPlot")

    )
  )
)
另一段server 區塊則是偏重邏輯的處理,在這邊可以看到distPlot 這個結果中有x, bins 兩個變數,x的資料來自faithful(這是R 的內建資料集,詳見),bins 則是一段數列,最後我們將以上結果化成長條圖hist。
# Define server logic required to draw a histogram ----
server <- function(input, output) {

  # Histogram of the Old Faithful Geyser Data ----
  # with requested number of bins
  # This expression that generates a histogram is wrapped in a call
  # to renderPlot to indicate that:
  #
  # 1. It is "reactive" and therefore should be automatically
  #    re-executed when inputs (input$bins) change
  # 2. Its output type is a plot
  output$distPlot <- renderPlot({

    x    <- faithful$waiting
    bins <- seq(min(x), max(x), length.out = input$bins + 1)

    hist(x, breaks = bins, col = "#75AADB", border = "white",
         xlab = "Waiting time to next eruption (in mins)",
         main = "Histogram of waiting times")

    })

}
我們可以發現我們在server 裡將相關結果存到output$distPlot,在看到ui 區塊,將distPlot 畫出。最後執行shinyApp就可以得到我們的結果囉!
shinyApp(ui = ui, server = server)
以上就是shiny系列的第一篇文章!
Ref:
今天沒有程式碼


 iThome鐵人賽