老闆:嗯?我今天不用問問題?
看來會有問題的不只老闆而已...今天要介紹的是shiny 提供的Progress indicators,會用到的時機很多,像是我們目前很耗時的經緯度抓取,就是一個非常適合套用的地方,首先,我們先來看看基本用法。
server <- function(input, output) {
  output$plot <- renderPlot({
    input$goPlot # Re-run when button is clicked

    # Create 0-row data frame which will be used to store data
    dat <- data.frame(x = numeric(0), y = numeric(0))

    withProgress(message = 'Making plot', value = 0, {
      # Number of times we'll go through the loop
      n <- 10

      for (i in 1:n) {
        # Each time through the loop, add another row of data. This is
        # a stand-in for a long-running computation.
        dat <- rbind(dat, data.frame(x = rnorm(1), y = rnorm(1)))

        # Increment the progress bar, and update the detail text.
        incProgress(1/n, detail = paste("Doing part", i))

        # Pause for 0.1 seconds to simulate a long computation.
        Sys.sleep(0.1)
      }
    })

    plot(dat$x, dat$y)
  })
}

ui <- shinyUI(basicPage(
  plotOutput('plot', width = "300px", height = "300px"),
  actionButton('goPlot', 'Go plot')
))

shinyApp(ui = ui, server = server)
每當你要使用時,需要withProgress 將邏輯包起來,接著使用incProgress來更新進度。每個progress 的進度值介於0~1之間,所以incProgress 的第一個參數就是放要增加多少數值,像這個例子就是0.1,最後會看到progress bar 是10%, 20%, 30%....100% 在跳。
好,接著我們回到我們的程式碼,我們首先在input$request 這個按鈕的event 中用withProgress 將邏輯包起來。
observeEvent(input$request, {
    withProgress(message = '擷取經緯度', value = 0, {
        v$addressWithLatLng <- v$address %>%
            rowwise() %>%
            mutate(LatLng = getLatLng(V1) %>%
            filter(LatLng!="error") %>%
            separate(LatLng, c("Lat", "Lng"), sep=",") %>%
            mutate(Lat=as.numeric(Lat), Lng=as.numeric(Lng))

    })
})
再來是考慮到incProgress 的擺放位置,目前我們的邏輯都被dplyr 的鏈結式寫死了,我們是可以把incProgress 放到draw_map_function.R 的getLatLng() 裡面,可是這麼一來,程式碼就被污染了!因為我們把shiny 的ui 程式碼放進draw_map_function.R ,如果未來有人想使用draw_map_function.R 但是不一定要跟ui 有關就會噴出錯誤。
為了避免以上的問題,我這邊的解決辦法是在宣告另一個函式getLatLngWithProcress(),這個函式會incProgress 並同時去執行getLatLng(),並將結果return出來,這麼一來和shiny 有關的程式碼就不會污染到其他地方。
getLatLngWithProcress = function(address, total) {
    incProgress(1/total, detail = "解析地址中")
    return (getLatLng(address))
}
有了這個函式後,我們再回到dplyr 鏈結式,將原先的getLatLng() 替換成getLatLngWithProcress()。
observeEvent(input$request, {
    withProgress(message = '擷取經緯度', value = 0, {
        v$addressWithLatLng <- v$address %>%
            rowwise() %>%
            mutate(LatLng = getLatLngWithProcress(V1, nrow(v$address))) %>%
            filter(LatLng!="error") %>%
            separate(LatLng, c("Lat", "Lng"), sep=",") %>%
            mutate(Lat=as.numeric(Lat), Lng=as.numeric(Lng))

    })
})
接下來執行後,按下取資料就可以看到右下角的地方多出了進度條囉!
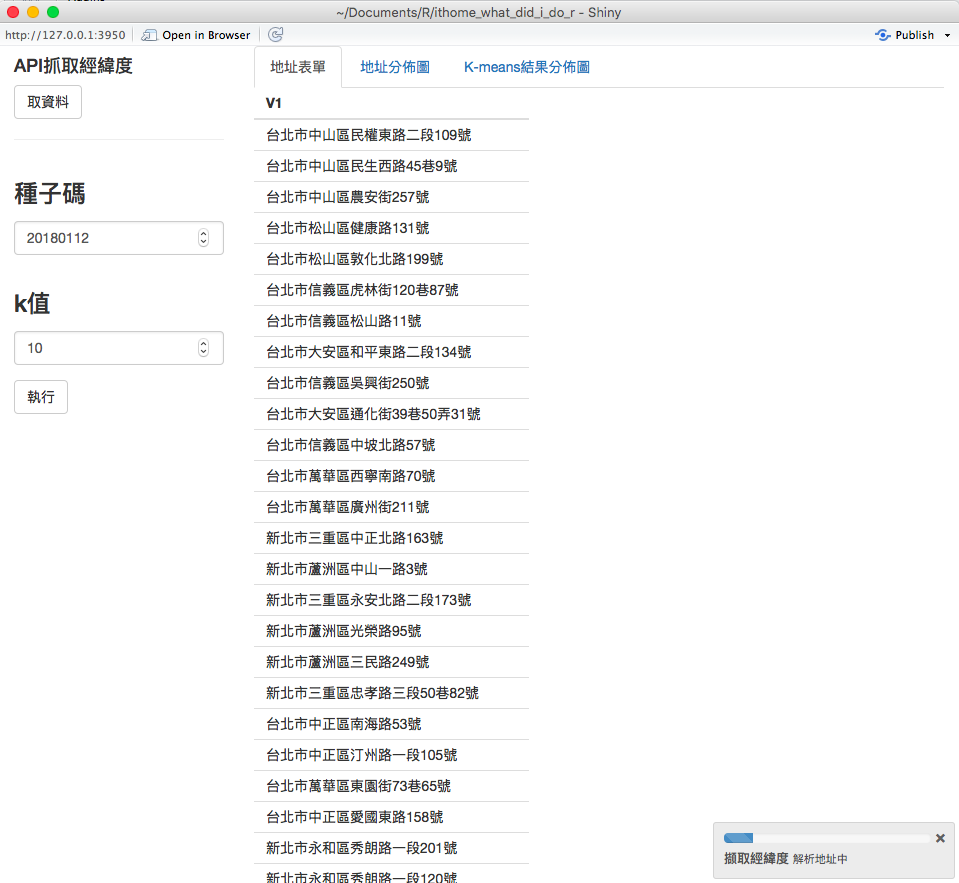
接近完成時的progress bar
下次,就把使用者體驗做好做滿,讓大家覺得好用吧!
ref
day27程式碼


 iThome鐵人賽