iT邦幫忙

2018 iT 邦幫忙鐵人賽
DAY 24
1
Data Technology

Microsoft R Solution系列 第 24

Day24 - Power BI 與 R 互動

Power BI剛推出時是Excel 2013的增益集, 當年的底層是用Silverlight, 當年一推出被蠻多人看好, 連筆者也是, 只是隨著Html5的興起, 一直希望它能廢掉Silverlight, 底層改用Html5, 後來Silverlight終於被打入冷宮, Power BI也獨立出來變成一個完整的產品, 本機開發是免費, 但是要發佈到網路上或是與他人協同合作, 超過一定的流量就必須付費, 可參考底下網址
https://powerbi.microsoft.com/en-us/pricing/
https://ithelp.ithome.com.tw/upload/images/20180111/201033337U4mLcoIxv.png

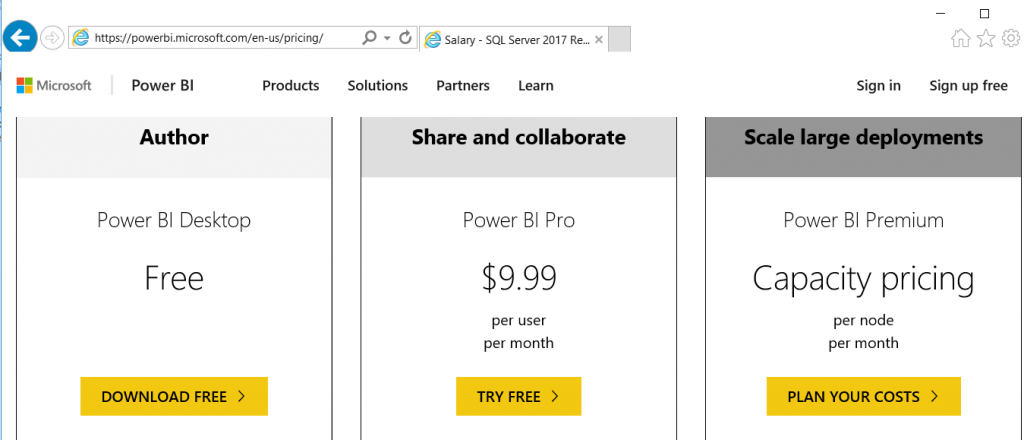
有人可能會有想Microsoft已經有了SSRS的報表平台, 為甚麼還要有Power BI呢? SSRS做出來的報表比較偏向於靜態的表格報表, 而Power BI比較著重於資料間的互動關係如互動式儀表板, 甚至可以用類似動畫的方式呈現, 最著名是會動的泡泡圖(https://www.youtube.com/watch?v=sxTjqa_naW0), SSRS是無法做出這種報表的, 另外Power BI的競爭對手是Tableau與QlikView等類型廠商, 而這些廠商都有支援R Script, 所以Power BI亦不例外, 加入支援R Script如下
https://ithelp.ithome.com.tw/upload/images/20180111/20103333EZMd4yFFKZ.png

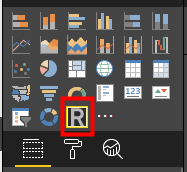
所以本篇會利用Power BI Desktop的版本來實作上一篇SSRS報表, 透過上述連結, 下載Power BI Desktop的安裝程式, 執行如下
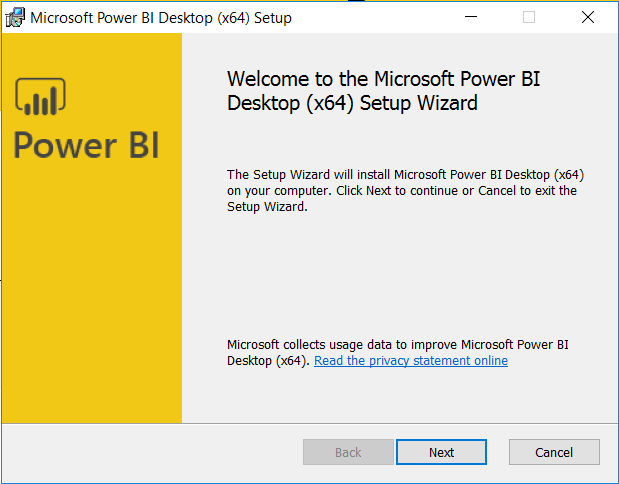
https://ithelp.ithome.com.tw/upload/images/20180111/20103333rmepiP0Laj.png

一路Next安裝到底
https://ithelp.ithome.com.tw/upload/images/20180111/201033337RLmebNvpG.png

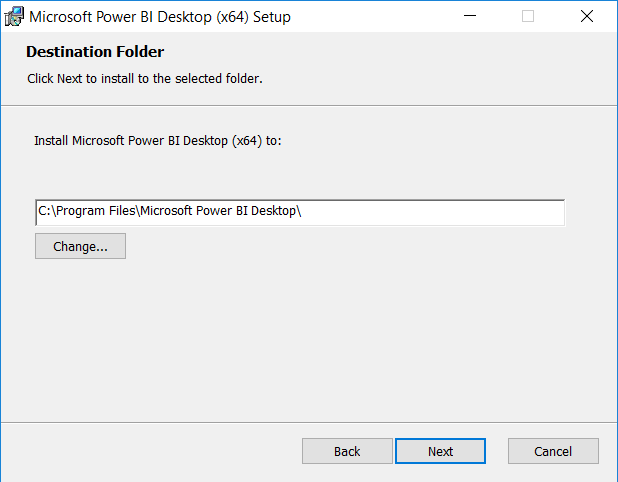
安裝完成之後, 會自動開啟Power BI並要求註冊一個Power BI的帳號, 才能使用如下
https://ithelp.ithome.com.tw/upload/images/20180111/20103333QJU9WeHL5S.png

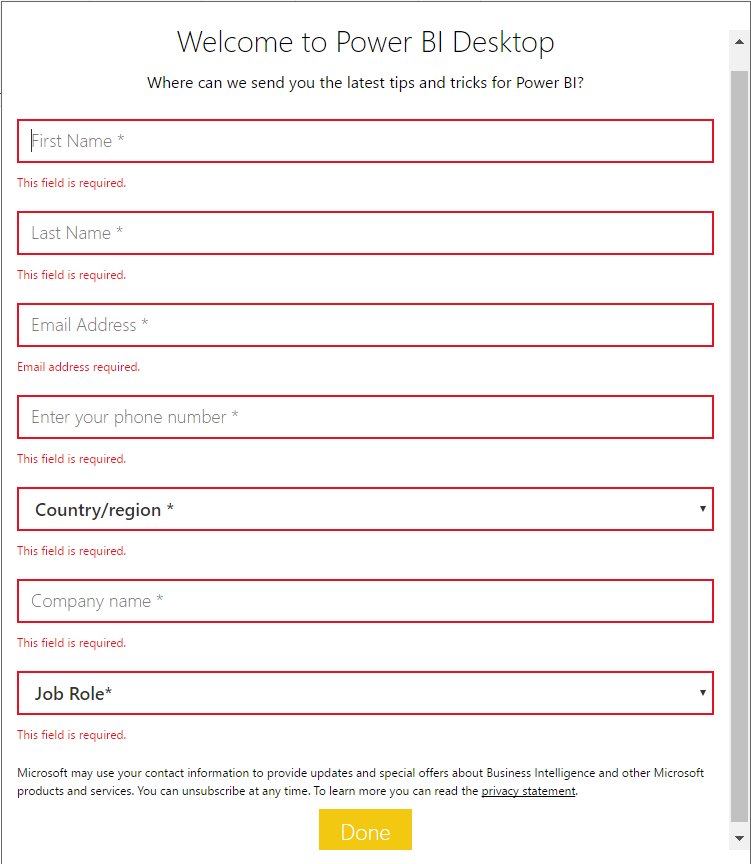
登入成功會看到底下的登入畫面, 可以先關掉
https://ithelp.ithome.com.tw/upload/images/20180111/20103333dveXkMLlG7.png

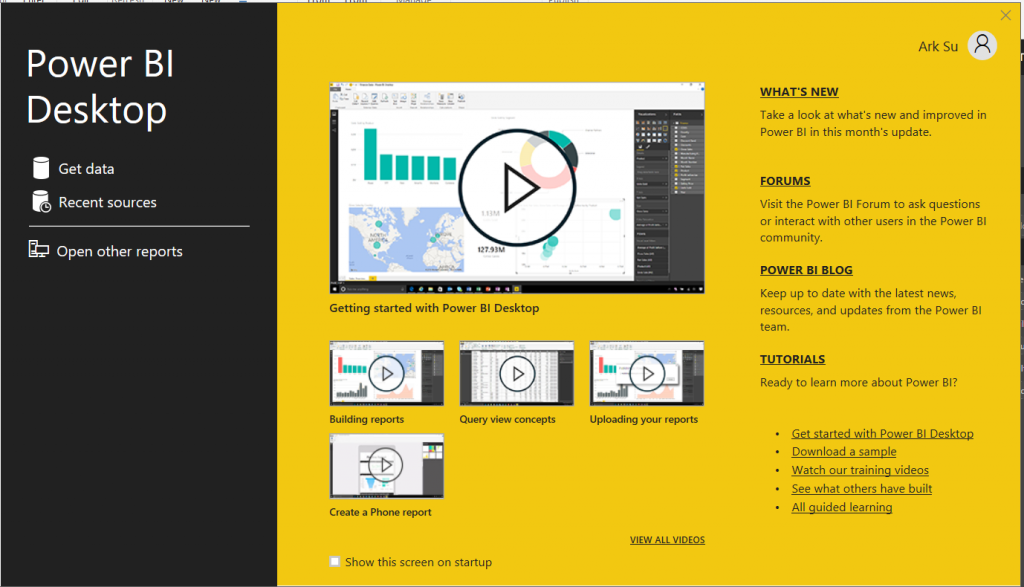
在開始開發之前, 可以先來看一下R Script的設定, 在File頁籤下, 找到Options and settings, 然後點選Options如下
https://ithelp.ithome.com.tw/upload/images/20180111/20103333Cjy5ZpTbSa.png

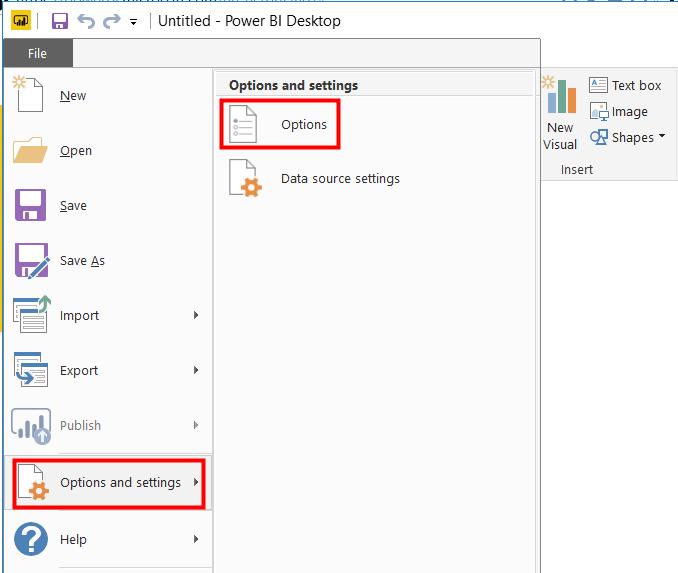
在Options裡, 點選R Scripting, 可以看到兩個設定選項, 一個是R執行的版本, 另一個是R的外部IDE工具, 確定沒問題後, 按下OK, 回到Power BI的工作視窗
https://ithelp.ithome.com.tw/upload/images/20180111/201033331HPSfj9M36.png

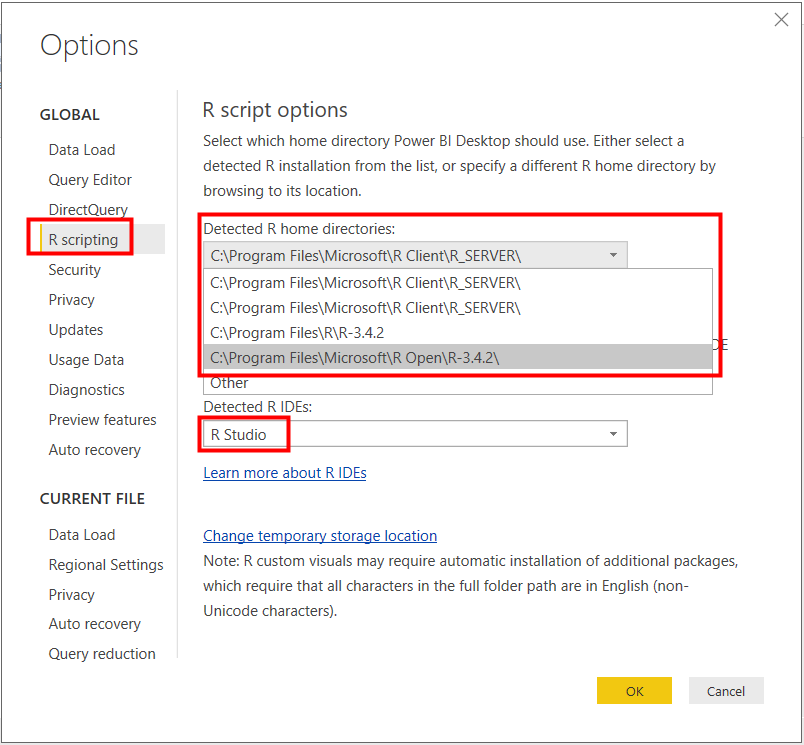
接下來在Home頁籤下, 點選Get Data後, 選擇SQL Server
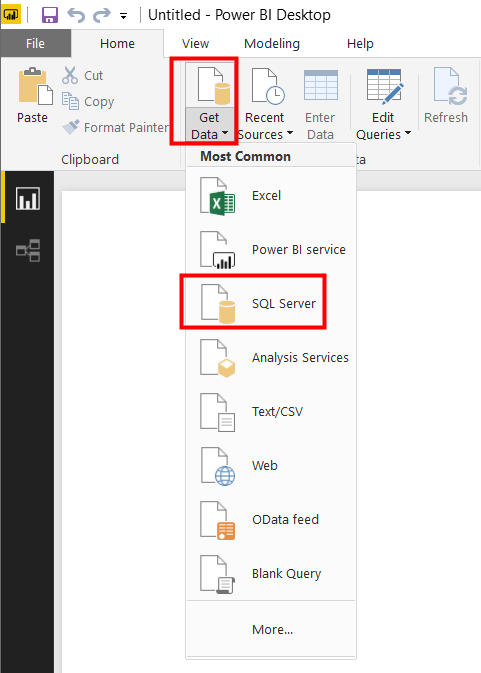
https://ithelp.ithome.com.tw/upload/images/20180111/20103333imSyRbvuoJ.png

填入MSSQL位置後, 按下OK
https://ithelp.ithome.com.tw/upload/images/20180111/201033335PCSp7l3eF.png

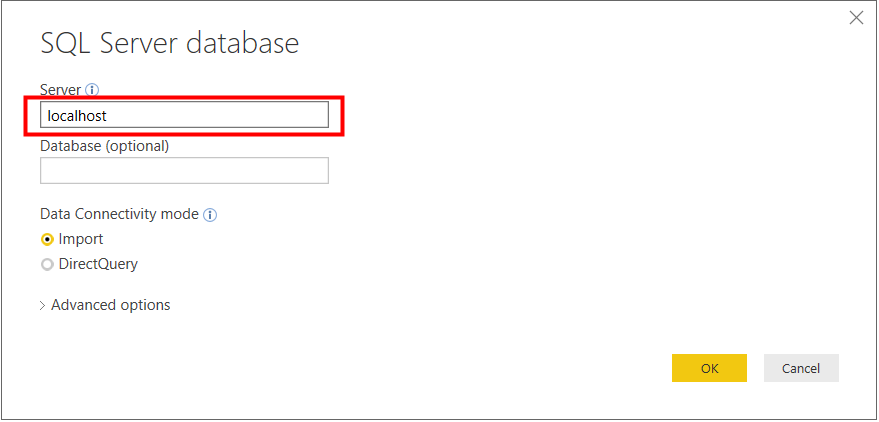
接著切換到Database頁籤, 輸入資料庫帳密後, 按下Connect
https://ithelp.ithome.com.tw/upload/images/20180111/20103333AO9XArkzcT.png

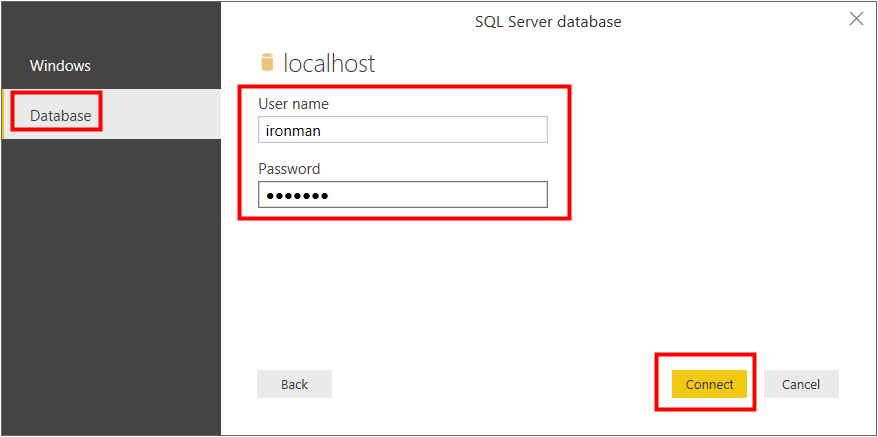
此時會跳出無法使用加密連線, 改用未加密連線, 按下OK即可
https://ithelp.ithome.com.tw/upload/images/20180111/20103333P5OunhMOaZ.png

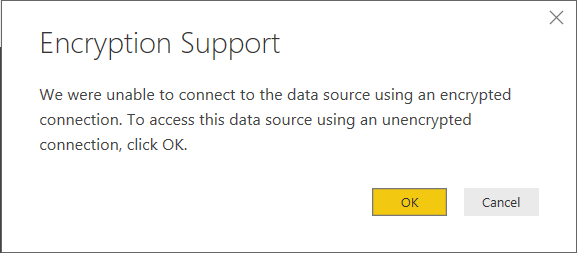
之後會出現可供匯入的資料表, 選擇之前建好的薪資職等表後, 按下Load
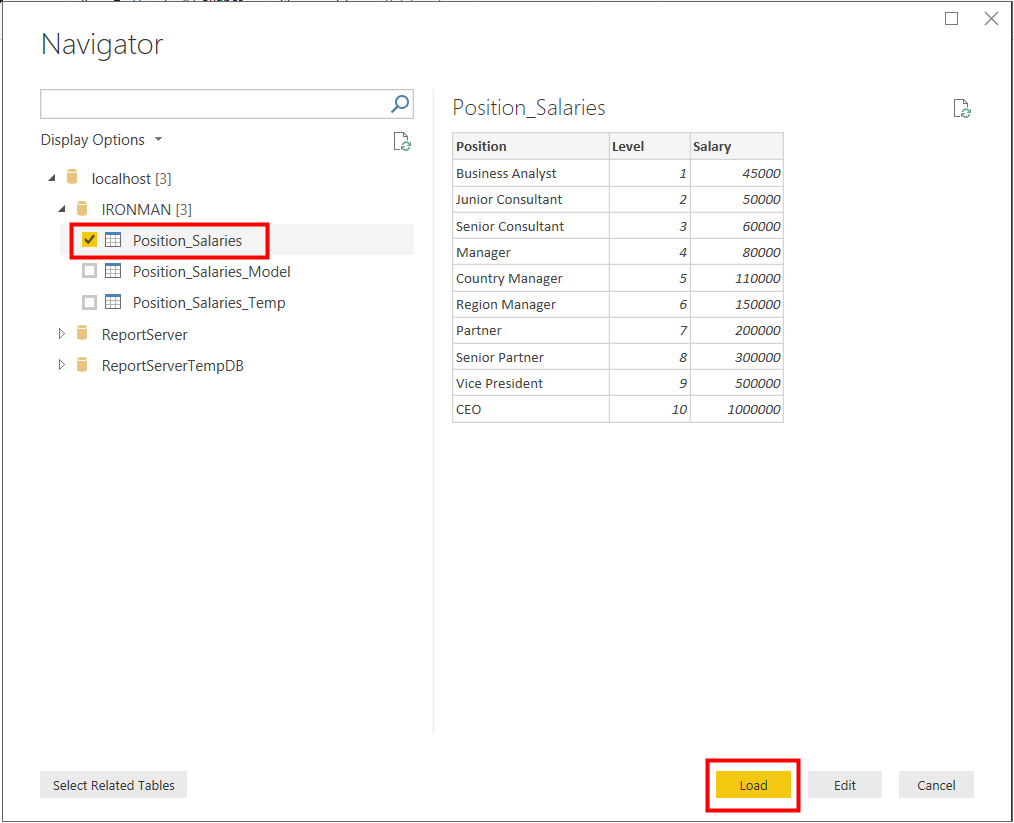
https://ithelp.ithome.com.tw/upload/images/20180111/201033338QreCdIfmW.png

之後可以右側看到匯入的資料表
https://ithelp.ithome.com.tw/upload/images/20180111/20103333yyUkgPAJIK.png

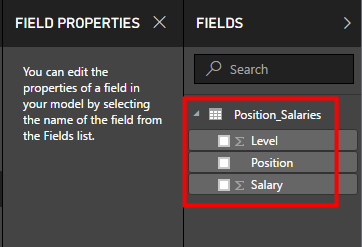
此時先點選右邊的VISUALIZATIONS裡的表格圖示, 左方就會出現空白的表格物件
https://ithelp.ithome.com.tw/upload/images/20180111/20103333bcULWihzyx.png

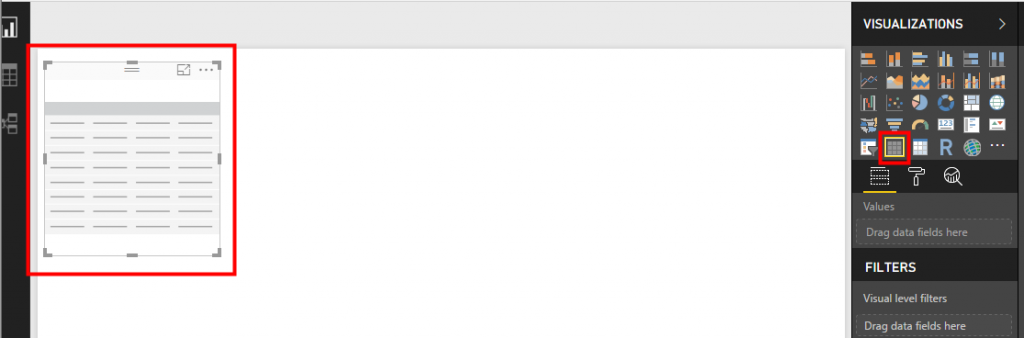
然後將勾選FIELDS裡的欄位, 資料就會出現在表格物件裡如下
https://ithelp.ithome.com.tw/upload/images/20180111/20103333BqLSqbVpK4.png

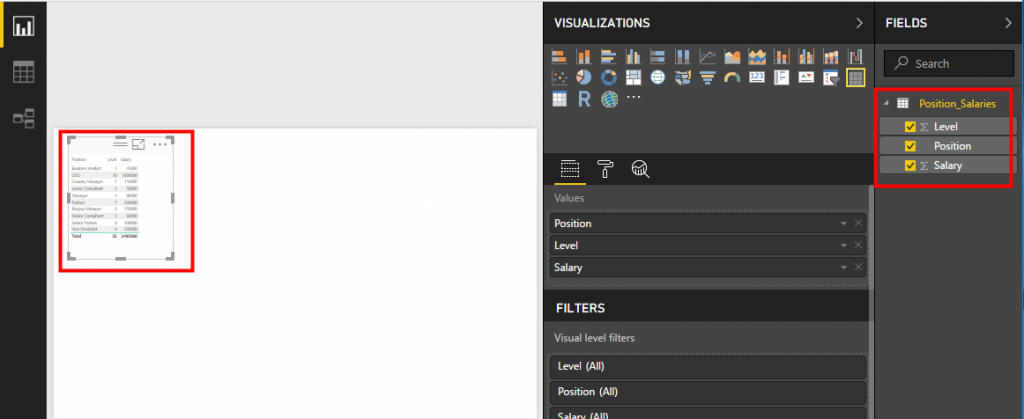
若嫌字體太小, 可以在VISUALIZATIONS面板下, 找到Format的圖示, 點擊之後找到Values展開, 可以看到Text Size來調整文字大小
https://ithelp.ithome.com.tw/upload/images/20180111/201033339mCdWTvKvQ.png

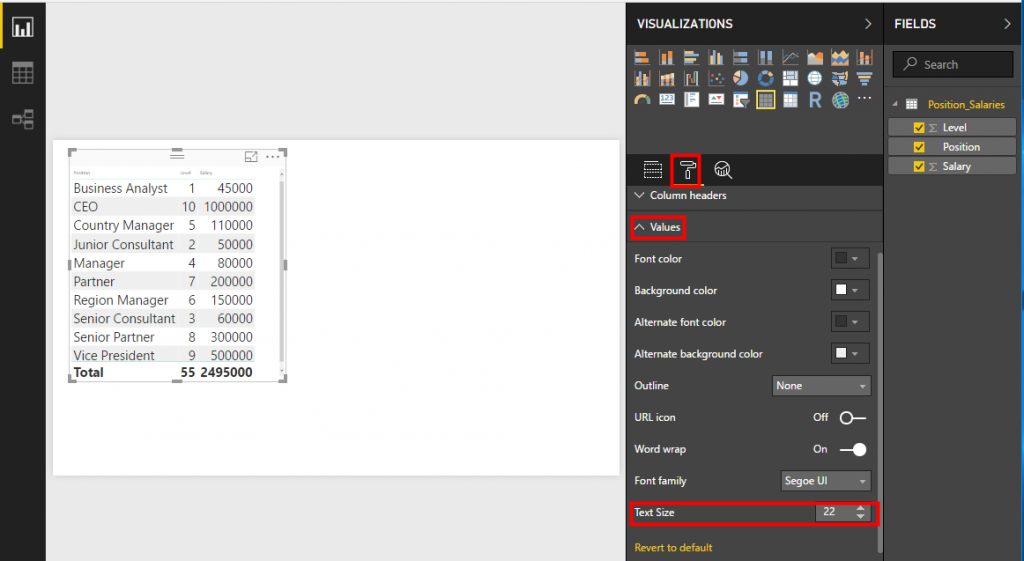
接下來若覺得不需要顯示Total, 可以展開Total, 將之關閉如下
https://ithelp.ithome.com.tw/upload/images/20180111/2010333320VtkDEDxJ.png

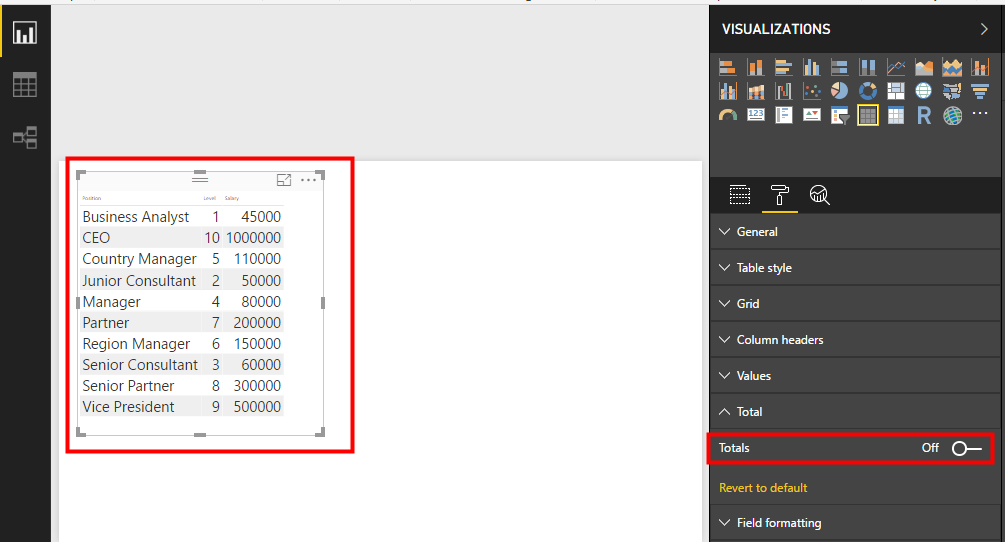
若要將Salary以千分位顯示的話, 先點選Salary欄位, 然後在Modeling頁籤, Data type下方點選千分位符號, 表格物件內的Salary欄位就會以千分位顯示
https://ithelp.ithome.com.tw/upload/images/20180111/20103333zY4HXQklYn.png

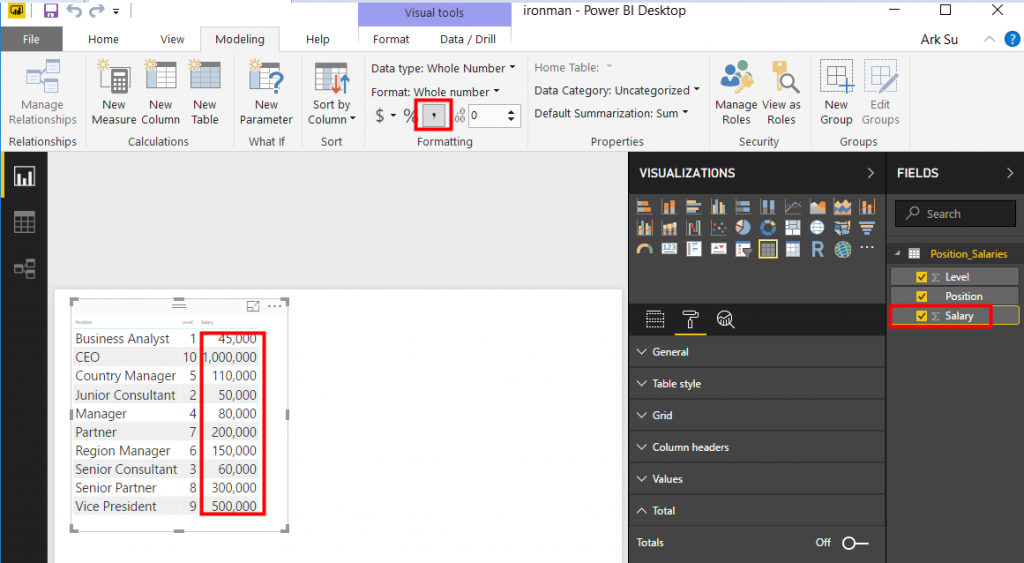
接下來順便展示一下何謂互動行報表?, 點選Table物件, Ctrl + C複製, Ctrl + V貼上如下
https://ithelp.ithome.com.tw/upload/images/20180111/20103333lKVbZh6BLE.png

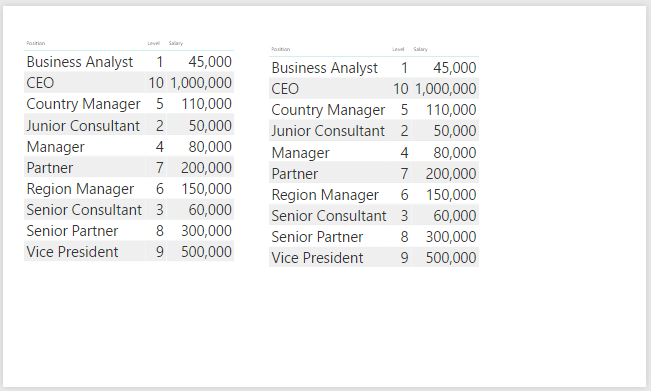
點選新複製的Table物件, 按下VISUALIZATIONS面板下圓餅圖示
https://ithelp.ithome.com.tw/upload/images/20180111/20103333bRJAYEOw61.png

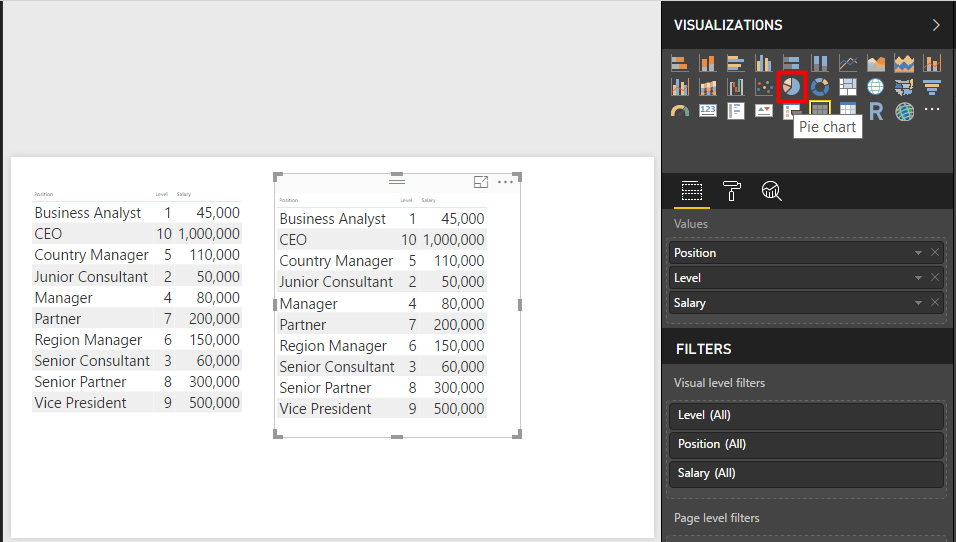
會直接將Table物件轉成圓餅圖物件, 然後在Values裡, 只留下Salary欄位如下
https://ithelp.ithome.com.tw/upload/images/20180111/201033339NeTkigifU.png

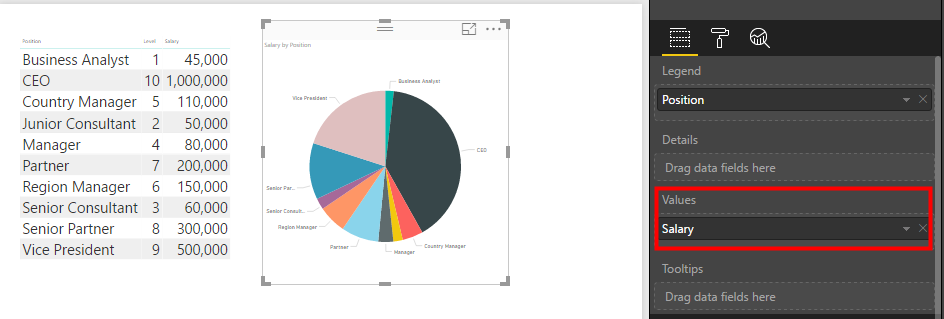
再來直接在Table物件點選CEO, 則旁邊的圓餅圖跟著連動, 只凸顯CEO的資料, 這就是互動型報表
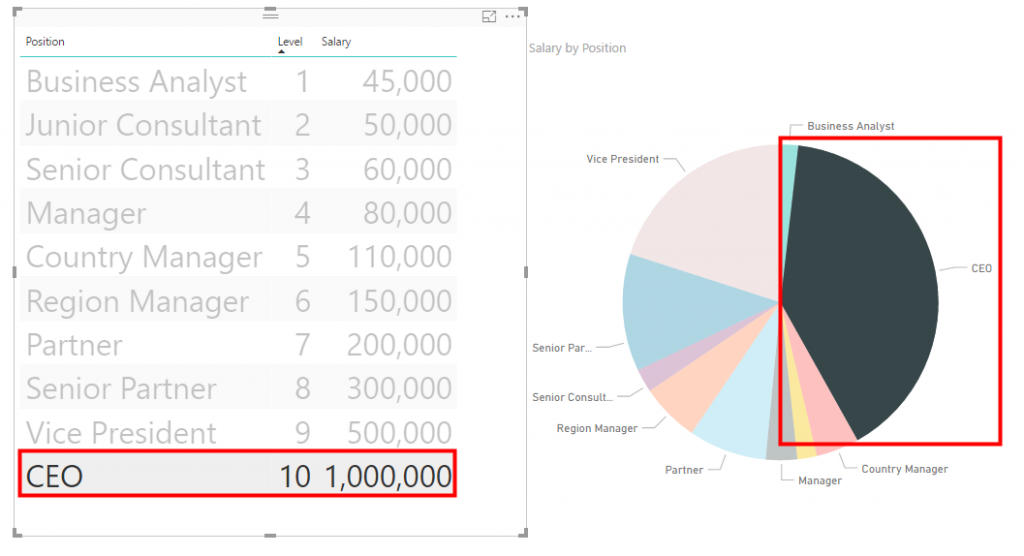
https://ithelp.ithome.com.tw/upload/images/20180111/20103333fZvyPNgzqR.png

接著調整一下版面, 把右邊留給R使用
https://ithelp.ithome.com.tw/upload/images/20180111/201033334blw5VttzO.png

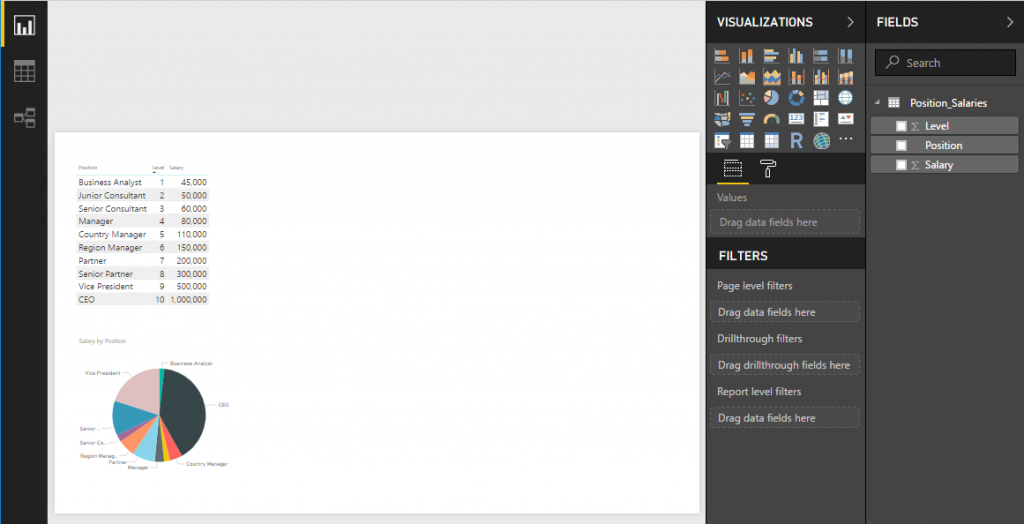
然後按下VISUALIZATIONS面板下圓餅圖示, 將FILEDS下的Level與Salary欄位勾選
https://ithelp.ithome.com.tw/upload/images/20180111/201033331N5Pydx1Az.png

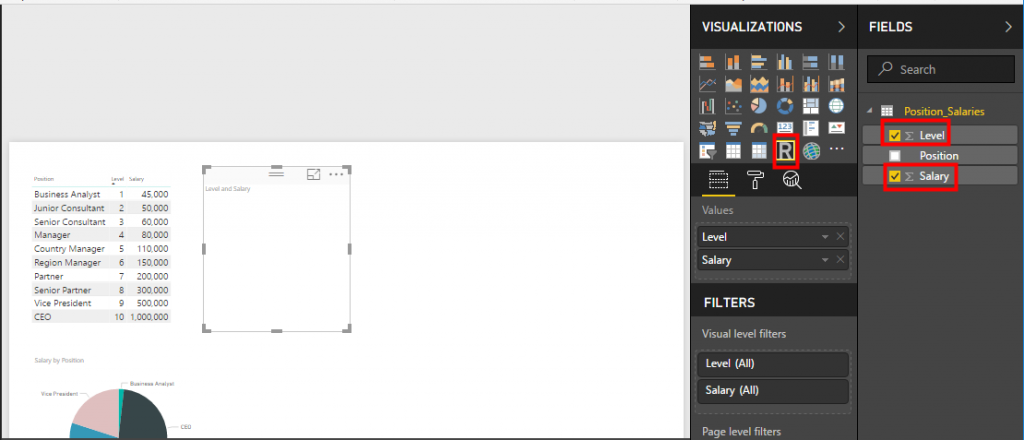
另外Power BI下方可以看到R script editor, 這邊可以看到Power BI會將Level與Salary組成data frame在R裡面使用, 底下的空白處就可以來寫R程式碼
https://ithelp.ithome.com.tw/upload/images/20180111/20103333ZLjqIIZIpu.png

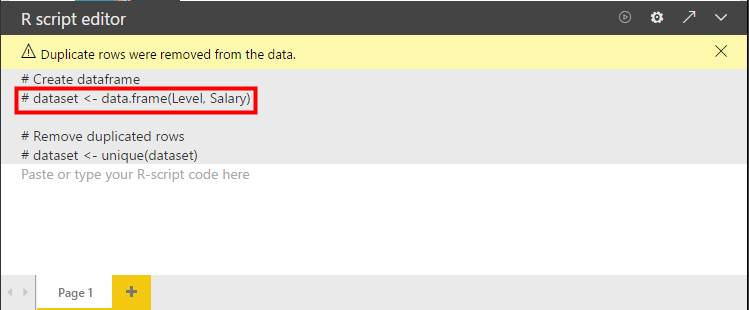
所以我們把Day08程式碼修改一下貼過來, 並按下執行的圖示, 結果如下
https://ithelp.ithome.com.tw/upload/images/20180111/20103333DoQdmxigdi.png

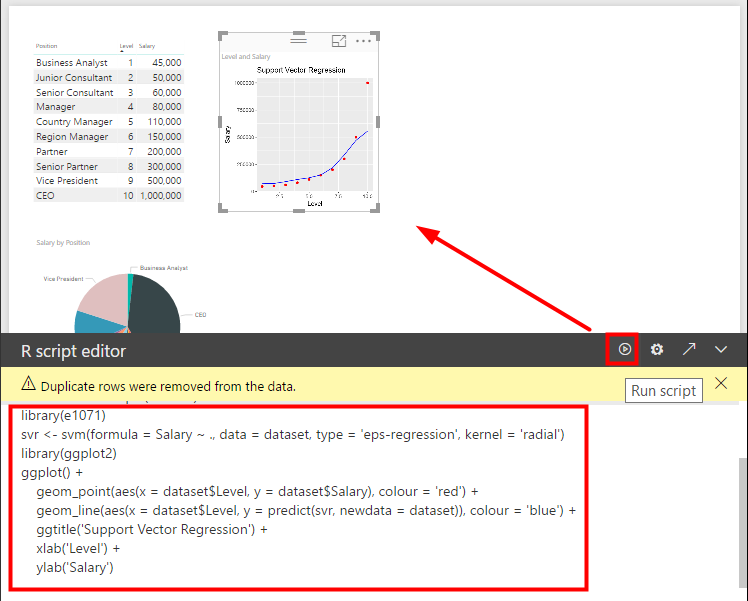
若嫌R script editor視窗太小, 不好編輯程式碼, 可以按下右上箭頭, 會開啟設定好外部IDE如下
https://ithelp.ithome.com.tw/upload/images/20180111/20103333MKWl8mJxVW.png

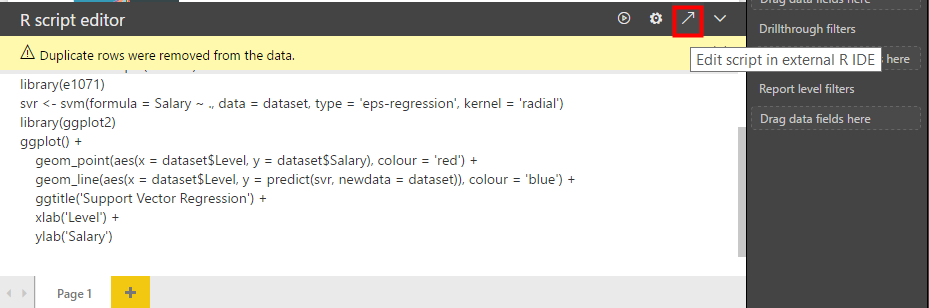
這邊要注意的是Power BI會自動將dataset帶過來, 但是在RStudio寫完後, 不會自動帶回到Power BI裡, 必須手動複製貼上
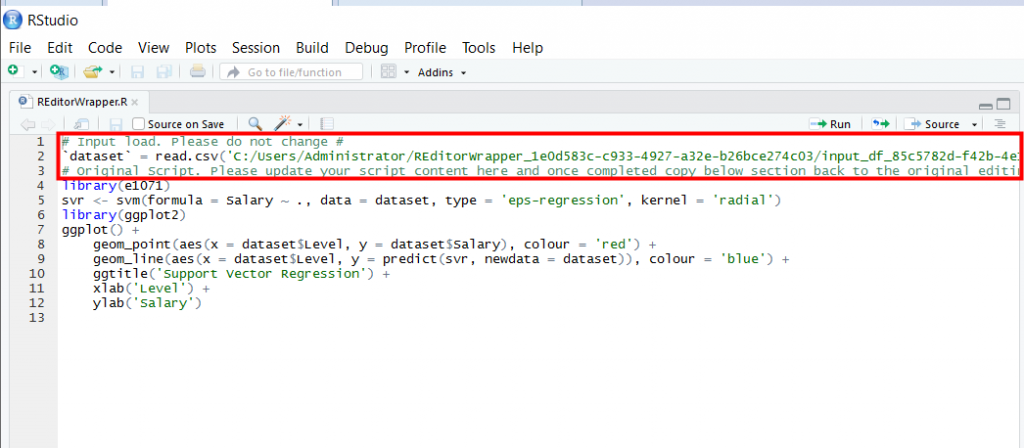
https://ithelp.ithome.com.tw/upload/images/20180111/20103333x57WGCo33d.png

最後調整一下版面如下
https://ithelp.ithome.com.tw/upload/images/20180111/20103333Zj3H5QOyMD.png

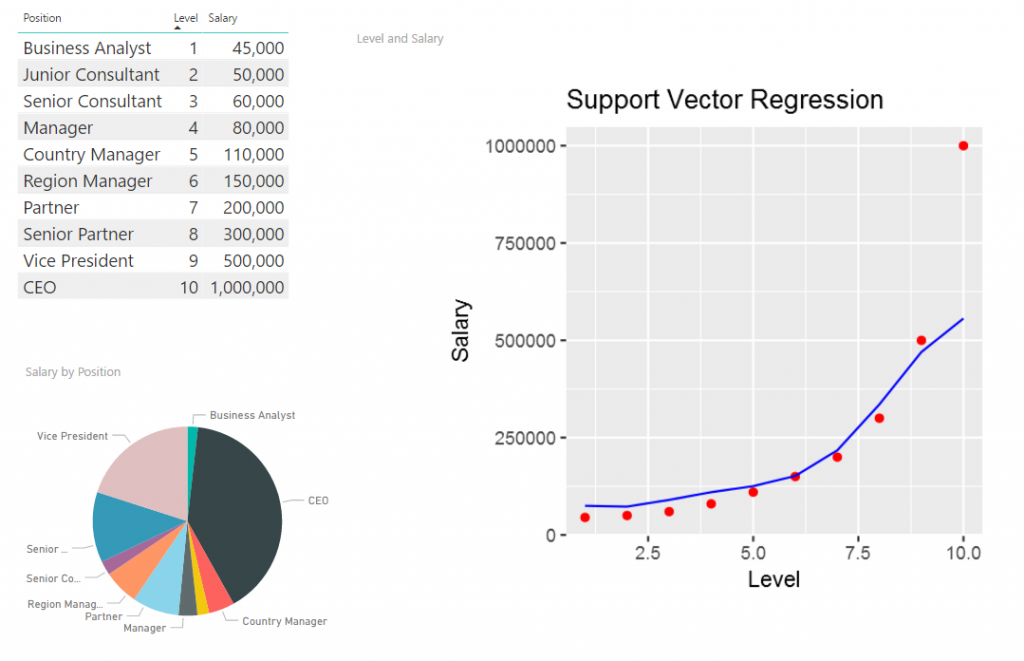
如果想在瀏覽器看這一張報表, 可以按下Publish
https://ithelp.ithome.com.tw/upload/images/20180111/20103333fEDVNB4MjG.png

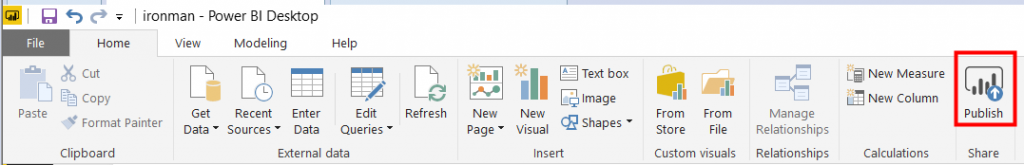
但是需要的是R繪圖在Free版本是無法顯示, 要付費的Pro版才給看
https://ithelp.ithome.com.tw/upload/images/20180111/20103333hYMMbn5Wta.png

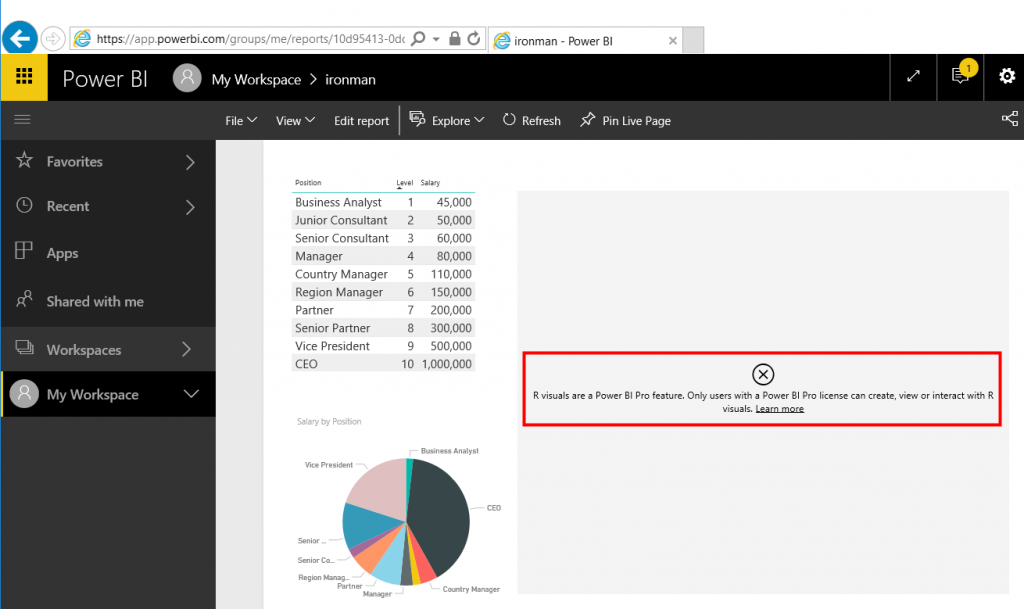
後記: 還是覺得RStudio的shiny(http://www.shinyapps.io/) 比較大氣一點, R繪圖 Free版本就能看了/images/emoticon/emoticon10.gif


上一篇
Day23 - MSSQL Reporting Service嵌入R 繪圖 Part2 SSRS報表開發
下一篇
Day25 – R Last Mile to Web Part1 Shiny
系列文
Microsoft R Solution30
圖片
  直播研討會
圖片
{{ item.channelVendor }} {{ item.webinarstarted }} |
{{ formatDate(item.duration) }}
直播中

1 則留言

0
Capillary J
iT邦新手 4 級 ‧ 2018-01-12 14:39:32

Power BI 拿來畫圖很方便!
但有時想做一些比較客製的變化就很容易被限制QQ
像之前想做即時資訊面板
但有限定一天只抓db一次..

arksu iT邦新手 2 級 ‧ 2018-01-12 19:50:44 檢舉

就是要你花錢解鎖阿, 用付費版/images/emoticon/emoticon10.gif

我要留言

立即登入留言