對於開發團隊而言,如何監控應用服務在 Server 上的資源使用一直是個很重要的課題,透過監控、可以偵測目前服務是否發生異常之外,也可以透過過去監控的資料對服務做最佳化。而 Kubernetes 也提供了一套監控系統 Heapster。
今天的學習筆記中將介紹,
Heapster 是一個對 Kubernetes Cluster 進行監控與性能採集的系統,透過 kubelet 取得 Node 上的資訊,透過 Restful API ,將收集到的資料(metrics) 傳到後端的儲存系統。目前 Heapster 支援的儲存系統很多種,有 Influxdb、Google Cloud Monitoring,Kafka 等等,在今天的實作中,將使用 Influxdb。
Influxdb 是一個用 Golang 寫、無需外部依賴的的分散式時序資料庫(time series database),主要用於處理以及分析與時序相關的監控數據。
Grafana 則提供我們一個可將這些數據視覺化的平台(Dashboard),將 Influxdb 中搜集到的大規模資料變成圖表呈現出來。
下圖是簡化過的 flow,kubelet 會搜集該 Node 上的情況,將資料傳到 Heapster Pod,Heapster 會把資料存到 InfluxDB Pod,最後 Grafana Pod 可以透過 InfluxDB 的 Restful API 從資料庫讀取資料,呈現在畫面上。

透過 Heapster、Influxdb 和 Grafana 的組合,我們能將 Kubernetes 每個 Node 與 Pod 上的資源使用狀況都透過圖表呈現出來。
首先,需要先從 Github 下載 heapter,這裡我們使用 wget,讀者也可以用 git clone 或其他指令,
$ wget https://github.com/kubernetes/heapster/archive/master.zip

接著解壓縮該檔案
$ unzip master.zip
會得到一個 heapster-master 的資料夾,接著進到 heapster-master 的 deploy/kube-config/influxdb 資料夾,會看到三個檔案,
$ ls
grafana.yaml  heapster.yaml influxdb.yaml
首先,編輯 grafana.yaml,
$ nano grafana.yaml
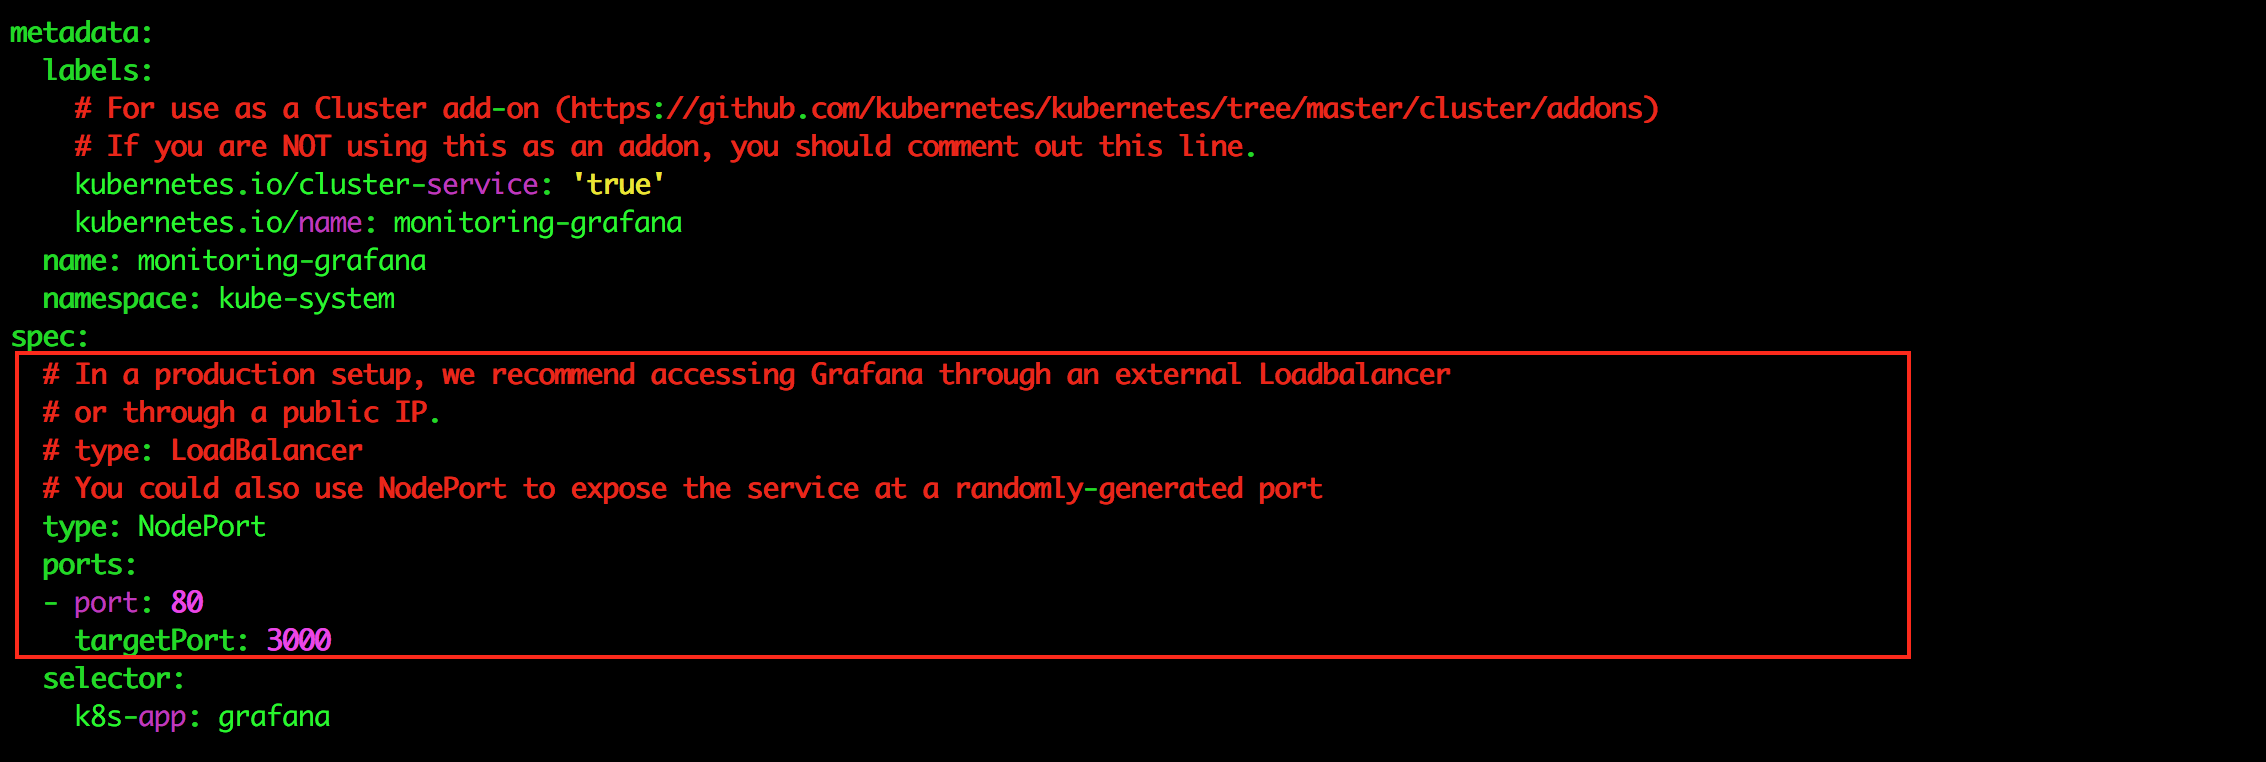
可以看到 YAML 檔的最後 monitoring-grafana service 的設定的部分,由於我們希望透過可以在外部資源存取 Grafana,因為要將 type: NodePort 的註解拿掉。值得注意的是,在實際場景環境中,推薦透過 type: LoadBalancer 來存取 Grafana Service ,

在修改完後,使用 kubectl create 指令創建 grafana.yaml、heapster.yaml、influxdb.yaml 所定義的資源,指令如下,
$ ls
grafana.yaml  heapster.yaml influxdb.yaml

$ kubectl create -f ./
deployment "monitoring-grafana" created
service "monitoring-grafana" created
serviceaccount "heapster" created
deployment "heapster" created
service "heapster" created
deployment "monitoring-influxdb" created
service "monitoring-influxdb" created
如此,Influx, Grafana 與 heapster 就在 minikube 中設置完成囉。用 kubectl get 指令查看,
$ kubectl get deploy,svc -n kube-system

確認物件都 Ready 後,透過 minikube service 找出 Grafana 所在的 url,
$ minikube service monitoring-grafana --url -n kube-system
http://192.168.99.100:32417
接著,在瀏覽器輸入 http://192.168.99.100:32417,便可以看到 Grafana 的畫面囉

接著,點選左上方的 Pod 選項,

可以看到,目前 Kubernetes Cluster 上目前系統 Pod 的狀態,

接著,透過 helloworld-app.yaml,跑起我們自己的 hello-world 服務,
apiVersion: apps/v1beta2
kind: Deployment
metadata:
  name: hello-deployment
spec:
  replicas: 3
  selector:
    matchLabels:
      app: helloworld-deployment
  template:
    metadata:
      labels:
        app: helloworld-deployment
    spec:
      containers:
      - name: my-pod
        image: zxcvbnius/docker-demo:latest
        ports:
        - containerPort: 3000
---
apiVersion: v1
kind: Service
metadata:
  name: helloworld-service
  namespace: default
spec:
  type: NodePort
  ports:
  - port: 80
    targetPort: 3000
  selector:
    app: helloworld-deployment
使用 kubectl create 指令創建 helloworld-depolyment 以及 helloworld-service 物件
$ kubectl create -f ./helloworld-app.yaml
deployment "hello-deployment" created
service "helloworld-service" created
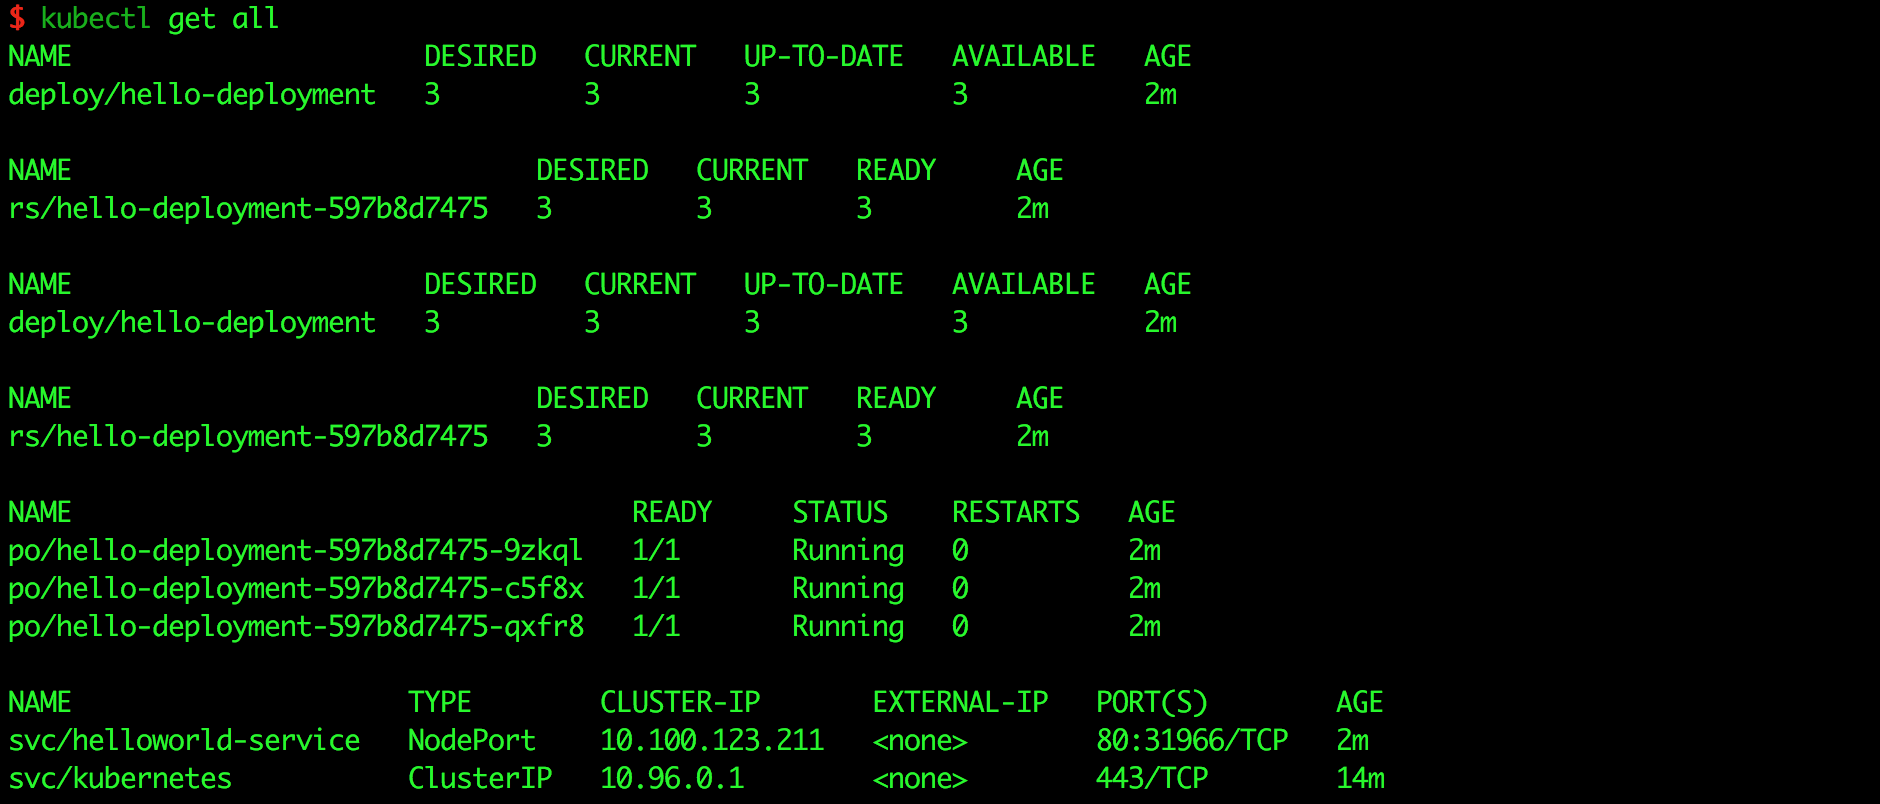
用 kubectl get 查看狀態,

確認都在運行後,再回到 Grafana 頁面,切換到 namespace: default,就可以看到目前 helloworld-pod 的資源使用狀態囉。

如果有興趣的讀者,不妨多送一些 requetes, 觀察 Grafana 的圖形變化囉。
在今天的學習筆記中,我們學習到如何在 Kubernetes 中架設監控系統,在明天的筆記中,將繼續介紹 Kubernetes 另一個也常在實際場景中的使用的元件,如何實現 AutoScaling。
最後,歡迎大家給予建議與討論,如果能按個讚給些鼓勵也是很開心唷 :)
