今天來介紹白努力多項單純貝式分類器
跟昨天介紹的Multinomial Naive Bayes的差別是,白努力適合boolean feature,所以就是1/0的分類。
那我們今天來換個資料庫好了,換成scikit-learn附帶的乳癌的資料庫(官方介紹)
先來引進要用的library,因為今天想要做做看給予訓練欄位多寡是否會影響機器判斷的準確率,所以引進了matplotlib來畫圖。
from sklearn.model_selection import train_test_split
from sklearn import datasets
from sklearn.metrics import accuracy_score
from sklearn.naive_bayes import BernoulliNB
import matplotlib.pyplot as plt

bc = datasets.load_breast_cancer()  #load進breast_cancer的資料庫

features = bc.feature_names
print(features)
乳癌資料庫的資料欄位好多,總共有30個feature的欄位
print(features)
['mean radius' 'mean texture' 'mean perimeter' 'mean area'
 'mean smoothness' 'mean compactness' 'mean concavity'
 'mean concave points' 'mean symmetry' 'mean fractal dimension'
 'radius error' 'texture error' 'perimeter error' 'area error'
 'smoothness error' 'compactness error' 'concavity error'
 'concave points error' 'symmetry error' 'fractal dimension error'
 'worst radius' 'worst texture' 'worst perimeter' 'worst area'
 'worst smoothness' 'worst compactness' 'worst concavity'
 'worst concave points' 'worst symmetry' 'worst fractal dimension']
然後從給予10個欄位到全部欄位,用n_scores蒐集每次跑出來的準確率數據
n = range(10, 31)
n_scores = []
for nn in n:
    X = bc.data[:,:nn] #取到第nn欄位
    y = bc.target

    X_train, X_test, y_train, y_test = train_test_split(X, y, test_size=0.3)
    clf = BernoulliNB(alpha=0.6) #alpha也是可以自由調整的
    clf.fit(X_train, y_train) #MultinomialNB(alpha=1.0, class_prior=None, fit_prior=True) #alpha->smoothing parameter(0 for no smoothing)
    y_result = clf.predict(X_test)
    n_scores.append(accuracy_score(y_test, y_result))
    print(nn)
    print("Number of mislabeled points out of a total %d points : %d"% (bc.data.shape[0],(y_test != y_result).sum()))
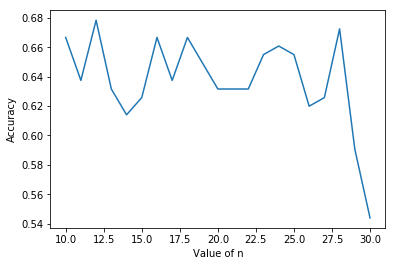
然後畫出圖來
plt.plot(n,n_scores)
plt.xlabel('Value of n')
plt.ylabel('Accuracy')
plt.show()

欸。。。給太多準確率還下降XD
不過其實也是要去仔細看他每個features的意義是什麼
不能像我這樣草率的按照順序分XD
