在此專案中,您將使用在課程中學到的工具來識別道路上的車道線。 您可以在一系列個別的圖像上利用pipeline,然後將結果應用於影片串流(實際上是一連串一圖像)。
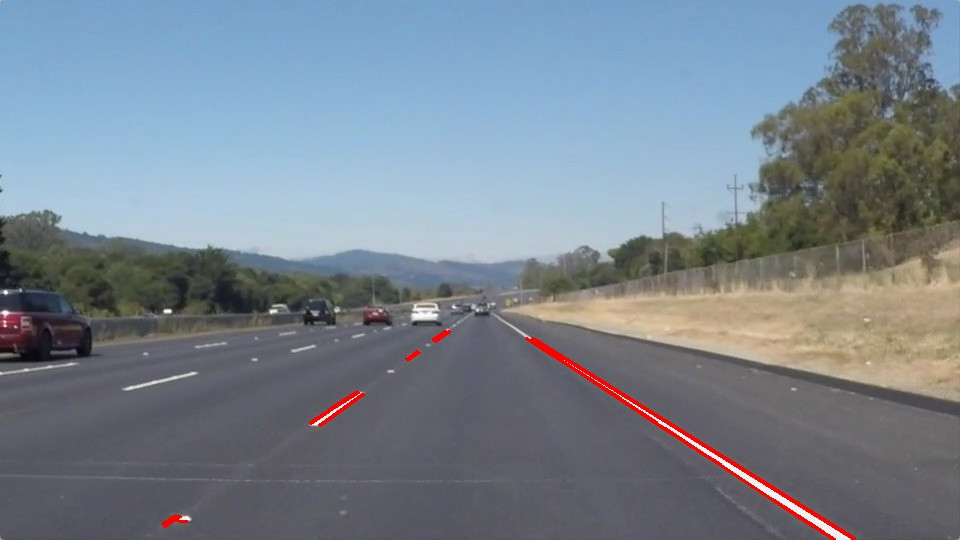
利用之前學的技術針對個別圖檔進行畫標註車道線,一開始初期處理如下圖
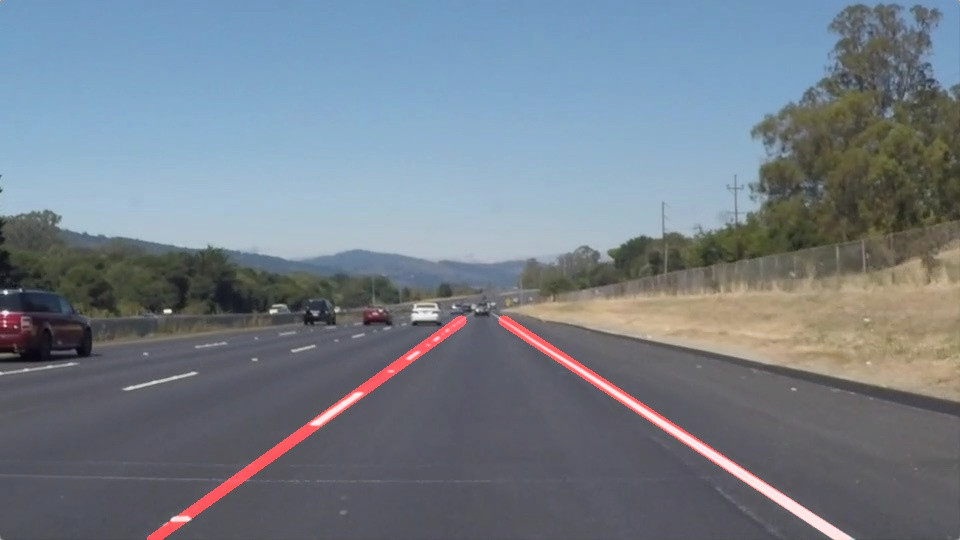
經過接/平均/外推線段處理以獲得較佳的輸出,如下圖
在此先行針對個別圖像,進行畫線工作,在此專案主要係要實作 draw_lines函式,後續再進行一連串圖像組成之影像進行車道標註處理。以下係第一階段程式執行[1]
#importing some useful packages
import matplotlib.pyplot as plt
import matplotlib.image as mpimg
import numpy as np
import cv2
%matplotlib inline
image = mpimg.imread('test_images/solidWhiteRight.jpg')

#printing out some stats and plotting
print('This image is:', type(image), 'with dimensions:', image.shape)
plt.imshow(image)  # if you wanted to show a single color channel image called 'gray', for example, call as plt.imshow(gray, cmap='gray')
import math

def grayscale(img):
   """Applies the Grayscale transform
   This will return an image with only one color channel
   but NOTE: to see the returned image as grayscale
   (assuming your grayscaled image is called 'gray')
   you should call plt.imshow(gray, cmap='gray')"""
   return cv2.cvtColor(img, cv2.COLOR_RGB2GRAY)
   # Or use BGR2GRAY if you read an image with cv2.imread()
   # return cv2.cvtColor(img, cv2.COLOR_BGR2GRAY)
"""
canny algorithm:calculates the intensity gradients of the image and applies double threshold to determine edges.
"""
def canny(img, low_threshold, high_threshold):
   """Applies the Canny transform"""
   return cv2.Canny(img, low_threshold, high_threshold)

def gaussian_blur(img, kernel_size):
   """Applies a Gaussian Noise kernel"""
   return cv2.GaussianBlur(img, (kernel_size, kernel_size), 0)

def region_of_interest(img, vertices):
   """
   Applies an image mask.

   Only keeps the region of the image defined by the polygon
   formed from `vertices`. The rest of the image is set to black.
   `vertices` should be a numpy array of integer points.
   """
   #defining a blank mask to start with
   mask = np.zeros_like(img)

   #defining a 3 channel or 1 channel color to fill the mask with depending on the input image
   if len(img.shape) > 2:
       channel_count = img.shape[2]  # i.e. 3 or 4 depending on your image
       ignore_mask_color = (255,) * channel_count
   else:
       ignore_mask_color = 255

   #filling pixels inside the polygon defined by "vertices" with the fill color
   cv2.fillPoly(mask, vertices, ignore_mask_color)

   #returning the image only where mask pixels are nonzero
   masked_image = cv2.bitwise_and(img, mask)
   return masked_image


def draw_lines(img, lines, color=[255, 0, 0], thickness=5):
   """
   NOTE: this is the function you might want to use as a starting point once you want to
   average/extrapolate the line segments you detect to map out the full
   extent of the lane (going from the result shown in raw-lines-example.mp4
   to that shown in P1_example.mp4).

   Think about things like separating line segments by their
   slope ((y2-y1)/(x2-x1)) to decide which segments are part of the left
   line vs. the right line.  Then, you can average the position of each of
   the lines and extrsfto the top and bottom of the lane.

   This function draws `lines` with `color` and `thickness`.
   Lines are drawn on the image inplace (mutates the image).
   If you want to make the lines semi-transparent, think about combining
   this function with the weighted_img() function below
   """
   """ define the the top and bottom of the lane"""
   top = 300
   bottom =540
   left_x1_set = []
   left_y1_set = []
   left_x2_set = []
   left_y2_set = []
   right_x1_set = []
   right_y1_set = []
   right_x2_set = []
   right_y2_set = []

   for line in lines:
       for x1,y1,x2,y2 in line:
           cv2.line(img, (x1, y1), (x2, y2), color, thickness)
           slope = get_slope(x1,y1,x2,y2)
           if slope < 0:
               # Ignore obviously invalid lines
               if slope > -.5 or slope < -.8:
                   continue
               left_x1_set.append(x1)
               left_y1_set.append(y1)
               left_x2_set.append(x2)
               left_y2_set.append(y2)
           else:
               # Ignore obviously invalid lines
               if slope < .5 or slope > .8:
                   continue
               right_x1_set.append(x1)
               right_y1_set.append(y1)
               right_x2_set.append(x2)
               right_y2_set.append(y2)
   try:
       avg_right_x1 = int(np.mean(right_x1_set))
       avg_right_y1 = int(np.mean(right_y1_set))
       avg_right_x2 = int(np.mean(right_x2_set))
       avg_right_y2 = int(np.mean(right_y2_set))
       right_slope = get_slope(avg_right_x1,avg_right_y1,avg_right_x2,avg_right_y2)

       right_y1 = top
       right_x1 = int(avg_right_x1 + (right_y1 - avg_right_y1) / right_slope)
       right_y2 = bottom
       right_x2 = int(avg_right_x1 + (right_y2 - avg_right_y1) / right_slope)
       cv2.line(img, (right_x1, right_y1), (right_x2, right_y2), color, thickness)
   except ValueError:
       # Don't error when a line cannot be drawn
       pass

   try:
       avg_left_x1 = int(np.mean(left_x1_set))
       avg_left_y1 = int(np.mean(left_y1_set))
       avg_left_x2 = int(np.mean(left_x2_set))
       avg_left_y2 = int(np.mean(left_y2_set))
       left_slope = get_slope(avg_left_x1,avg_left_y1,avg_left_x2,avg_left_y2)

       left_y1 = top
       left_x1 = int(avg_left_x1 + (left_y1 - avg_left_y1) / left_slope)
       left_y2 = bottom
       left_x2 = int(avg_left_x1 + (left_y2 - avg_left_y1) / left_slope)
       cv2.line(img, (left_x1, left_y1), (left_x2, left_y2), color, thickness)
   except ValueError:
       # Don't error when a line cannot be drawn
       pass
def get_slope(x1,y1,x2,y2):
   return ((y2-y1)/(x2-x1))


def hough_lines(img, rho, theta, threshold, min_line_len, max_line_gap):
   """
   `img` should be the output of a Canny transform.

   Returns an image with hough lines drawn.
   """
   lines = cv2.HoughLinesP(img, rho, theta, threshold, np.array([]), minLineLength=min_line_len, maxLineGap=max_line_gap)
   line_img = np.zeros((img.shape[0], img.shape[1], 3), dtype=np.uint8)
   draw_lines(line_img, lines)
   return line_img

# Python 3 has support for cool math symbols.
```python
def weighted_img(img, initial_img, α=0.8, β=1., γ=0.):
   """
   `img` is the output of the hough_lines(), An image with lines drawn on it.
   Should be a blank image (all black) with lines drawn on it.

   `initial_img` should be the image before any processing.

   The result image is computed as follows:

   initial_img * α + img * β + γ
   NOTE: initial_img and img must be the same shape!
   """
   return cv2.addWeighted(initial_img, α, img, β, γ)
萬事起頭難,第一個專案覺得沒有想像中容易,搞懂影像處理演算法,還有要摸索OpenCV-python語法
希望能愈來愈順利。