最後我們來學習如何將資料進行視覺化圖表輸出吧!
使用Anaconda一樣參照day3於環境中添加Pandas模組,預設是沒有安裝的,安裝完畢後就能引用模組到程式中,如下範例:
import matplotlib
import pandas as pd
import matplotlib

yearRange = pd.date_range('2013', periods=5, freq='Y')

gdp = [652429, 688434, 714774, 729381, 740082]

income = [561817, 599007, 624505, 637535, 643931]

expenditure = [353331, 366983, 373177, 384059, 392542]

SeriesGdp = pd.Series(gdp, index = yearRange)

SeriesIncome = pd.Series(income, index = yearRange)

SeriesExpenditure = pd.Series(expenditure, index = yearRange)

table = pd.DataFrame({'GDP' : SeriesGdp ,'年收入' : SeriesIncome, '年支出' : SeriesExpenditure})

#輸出:
               GDP   年收入   年支出
2013-12-31  652429  561817  353331
2014-12-31  688434  599007  366983
2015-12-31  714774  624505  373177
2016-12-31  729381  637535  384059
2017-12-31  740082  643931  392542
table.plot()
輸出: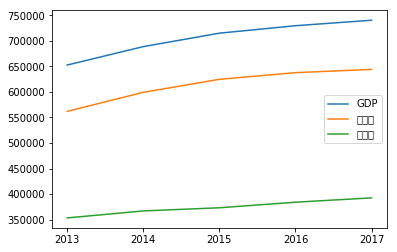
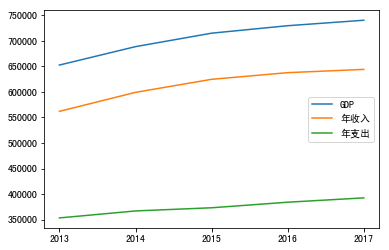
在matplotlib圖表使用中文無法顯示,可以從網站下載 SimHei 字體安裝,重啟程式後再加上以下代碼:
(解決方式)
matplotlib.rcParams['font.sans-serif']=['SimHei']
matplotlib.rcParams['axes.unicode_minus'] = False
就能正常輸出含有中文的圖表
plot()提供圖表的客製化函數如下
table.plot(color='red',marker='x', linestyle='-.', linewidth='2')
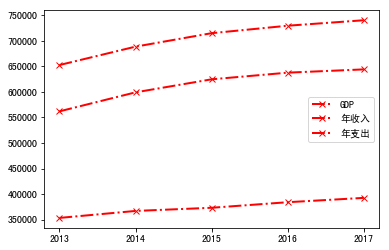
color(簡寫c):設定線條顏色
marker:折線點圖型
| 值 | 描述 | 符號 |
|---|
point|點|.
circle|圓圈|o
triangle_down|向下三角形|v
triangle_up|向上三角形|^
triangle_left|向左三角形|<
triangle_right|向右三角形|>
square|正方形|s
pentagon|五邊形|p
hexagonl|六邊形|h
plus|加號|+
x|打叉|x
diamond|鑽石|D
star|星號|*
vline|豎線|
linestyle(簡寫ls):線樣式
| 值 | 描述 | 符號 |
|---|
solid|實線|-
dashed|虛線|--
dashdot|線點|-.
dotted|點線|:
None|不畫線|
linewidth(簡寫lw):線寬度
Matplotlib提供非常多種圖形今天僅學習最簡單的折線圖,其餘圖表可以看Summer大大的文章.
參考文章:https://ithelp.ithome.com.tw/articles/10201004
文章內容如果有錯誤歡迎留言告知,可以幫忙糾正錯誤的觀念,感謝!