在機器學習當中KNN算是簡單的算法之一,但KNN穩定度是非常不穩定的,主要取決於K的設置,但K不是越大也不是越小越好,所以這就是我們困擾地方之一,還有KNN主要需計算輸入資料與現有的標記資料兩者的距離,這時候又產生一個問題,當維度越大計算量就越大,但若資料分群很明顯使用KNN還是一個不錯的方法,往後也可以拿來與其它機器學習合併做為參考。
這裡使用二維講解KNN,它公式很簡單,就是計算輸入資料與標記資料每個點距離取出K個距離最小值進行投票。這裡使用歐式距離。
1.創建標記資料與輸入資料。
這裡分為三群,使用concatenate將三群資料水平列(axis=0)合併,real_data為輸入資料。
# init
real_datas1 = np.array(np.random.rand(10, 2) * 5)
real_labels1 = np.array([0, 0, 0, 0, 0, 0, 0, 0, 0, 0])
real_datas2 = np.array(10 + np.random.rand(10, 2) * 5)
real_labels2 = np.array([1, 1, 1, 1, 1, 1, 1, 1, 1, 1])
real_datas3 = np.array(20 + np.random.rand(10, 2) * 5)
real_labels3 = np.array([2, 2, 2, 2, 2, 2, 2, 2, 2, 2])
# np.append
real_datas = np.concatenate((real_datas1, real_datas2, real_datas3), axis=0)
real_labels = np.concatenate((real_labels1, real_labels2, real_labels3))
input_data = np.array([7.5, 7.5])
2.距離函數。
參數:value1為標籤資料,value2為輸入資料。value1大小為[N, 2],value2大小為[2],這裡value2會往下自動擴展到[N, 2],計算完每個點距離後,設置axis=1垂直行加總,最後結果為與每個標記資料的距離。
註:若需要預測多筆則可使用擴展或一開始設置三維標記資料再用擴展。
def distance(value1, value2):
    return np.sum((value1 - value2) ** 2, axis=1)
參數:real_data和real_label為標籤資料,input_data為輸入資料,k為取幾個投票數。
使用argpartition得到索引由小到大,排序至k個並取出索引放入real_label取出真實標籤。而取出標籤後要進行投票取出哪個標籤最多,這時候可使用迴圈方法(註解部分),或使用one-hot方法(因可直接用sum指令水平列往上加即是投票結果)。
這裡使用one-hot,首先宣告一個數值為0、大小為[K, N群]的陣列,再將one_hot_labels放入索引位置指派1,結果即是one-hot,在使用sum設置axis=0往上加總,結果為投票結果,最後取出最大值的索引位置即是預測結果。
def predict(real_data, real_label, input_data, k):
    distances = distance(real_data, input_data)
    near_labels = real_label[np.argpartition(distances, np.arange(0, k, 1))[0:k]]
    one_hot_labels = np.zeros((k, class_type))
    one_hot_labels[np.arange(k), near_labels] = 1
    vote_labels = np.sum(one_hot_labels, axis=0)
    #vote_labels = np.zeros([class_type])
    #for index in range(class_type - 1) :
    #    vote_labels[index] = np.sum(near_labels == index)

    return np.argmax(vote_labels)
get_predict_color輸入為標籤,回傳為繪圖的顏色和形狀。
def get_predict_color(type):
    if type == 0:
        return 'yo'
    elif type == 1:
        return 'ro'
    else:
        return 'bo'

plt.plot(real_datas1[:, 0], real_datas1[:, 1], 'yo')
plt.plot(real_datas2[:, 0], real_datas2[:, 1], 'ro')
plt.plot(real_datas3[:, 0], real_datas3[:, 1], 'bo')
plt.plot(input_data[0], input_data[1], get_predict_color(predict_type))
plt.show()
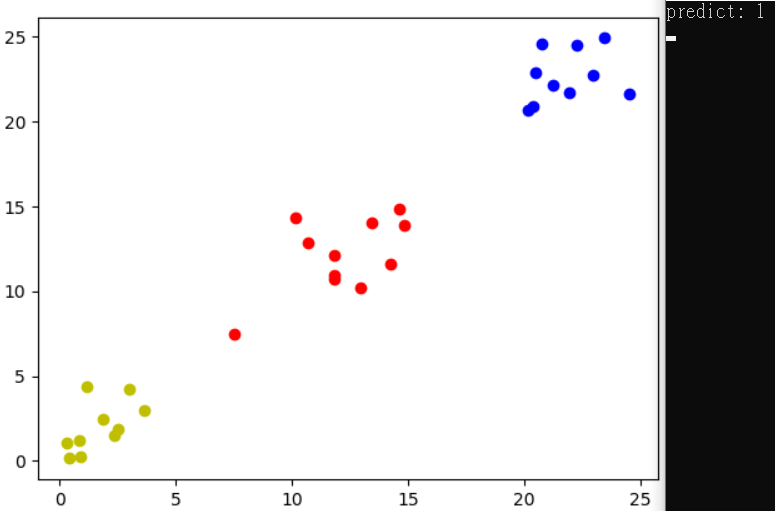
預測圖為第二類,有時候會第一類。
兩者非常相似,很多只差在宣告或API不同,但Tensorboard能方便提供可視化流程和數據給我們參考,所以如果需要給別人看流程或者數據可以使用Tensorflow來實作。
1.創建標記資料與輸入資料。
這裡分為三群,使用concat將三群資料水平列(axis=0)合併,real_data為輸入資料。
real_datas1 = tf.random_uniform([10, 2], minval=0, maxval=5, name="real_datas1")
real_labels1 = tf.constant([0, 0, 0, 0, 0, 0, 0, 0, 0, 0], name="real_labels1")
real_datas2 = tf.random_uniform([10, 2], minval=10, maxval=15, name="real_datas2")
real_labels2 = tf.constant([1, 1, 1, 1, 1, 1, 1, 1, 1, 1], name="real_labels2")
real_datas3 = tf.random_uniform([10, 2], minval=20, maxval=25, name="real_datas3")
real_labels3 = tf.constant([2, 2, 2, 2, 2, 2, 2, 2, 2, 2], name="real_labels3")

real_datas = tf.concat([real_datas1, real_datas2, real_datas3], axis=0, name="real_datas")
real_labels = tf.concat([real_labels1, real_labels2, real_labels3], axis=0, name="real_labels")
input_data = tf.constant([7.5, 7.5], dtype=tf.float32, name="input_data")
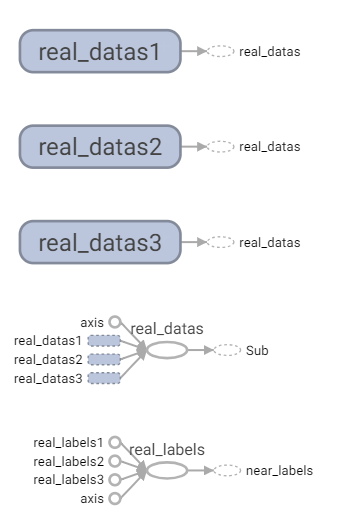
初始化數據。
2.距離函數。
參數:value1為標籤資料,value2為輸入資料。real_datas大小為[N, 2],input_data大小為[2],使用subtract計算矩陣減法,input_data會自動擴展至[N, 2],計算完每個點距離後,設置axis=1垂直行加總,最後結果為與每個標記資料的距離。
註:若需要預測多筆則可使用擴展或一開始設置三維標記資料再用擴展。
def distance(real_datas, input_data):
    diff = tf.subtract(real_datas, input_data) ** 2
    row_sum = tf.reduce_sum(diff, axis=1)
    return row_sum
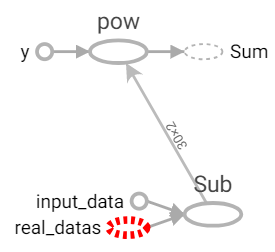
距離函數。
參數:real_datas和real_labels為標籤資料,input_data為輸入資料,k為取幾個投票數。
使用top_k得到k個由小到大(使用negative,top_k預設大到小)的索引值(indices),使用gather取出索引對應的真實標籤。使用one_hot_labels取得one-hot,在使用sum設置axis=0往上加總,結果為投票結果,最後取出最大值的索引位置即是預測結果。
def predict(real_datas, real_labels, input_data, k):
    distances = distance(real_datas, input_data)
    near_indexs = tf.nn.top_k(tf.negative(distances), k).indices
    near_labels = tf.gather(real_labels, near_indexs, name="near_labels")
    one_hot_labels = tf.one_hot(indices=near_labels, depth=class_type, on_value=1, off_value=0, name="one_hot_labels")
    count_labels = tf.reduce_sum(one_hot_labels, axis=0)

    return tf.argmax(count_labels)
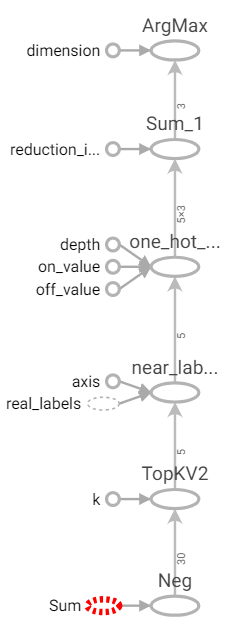
預測函數。
plt.plot(session.run(real_datas1[:, 0]), session.run(real_datas1[:, 1]), 'yo')
plt.plot(session.run(real_datas2[:, 0]), session.run(real_datas2[:, 1]), 'ro')
plt.plot(session.run(real_datas3[:, 0]), session.run(real_datas3[:, 1]), 'bo')
plt.plot(session.run(input_data[0]), session.run(input_data[1]), get_predict_color(predict_type))
plt.show()
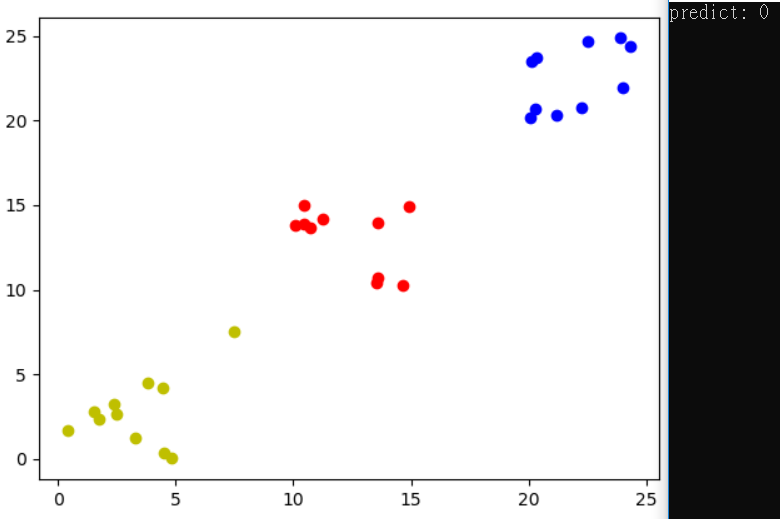
預測圖為第一類,有時候會第二類。
參考的東西其實算是之前上人工智慧課程老師介紹的,但不知該如何打所以省略,下次介紹計算方式有些地方很像的KMean,若有問題或錯誤歡迎留言或私訊。
[1] https://www.tensorflow.org/api_docs/python/tf
