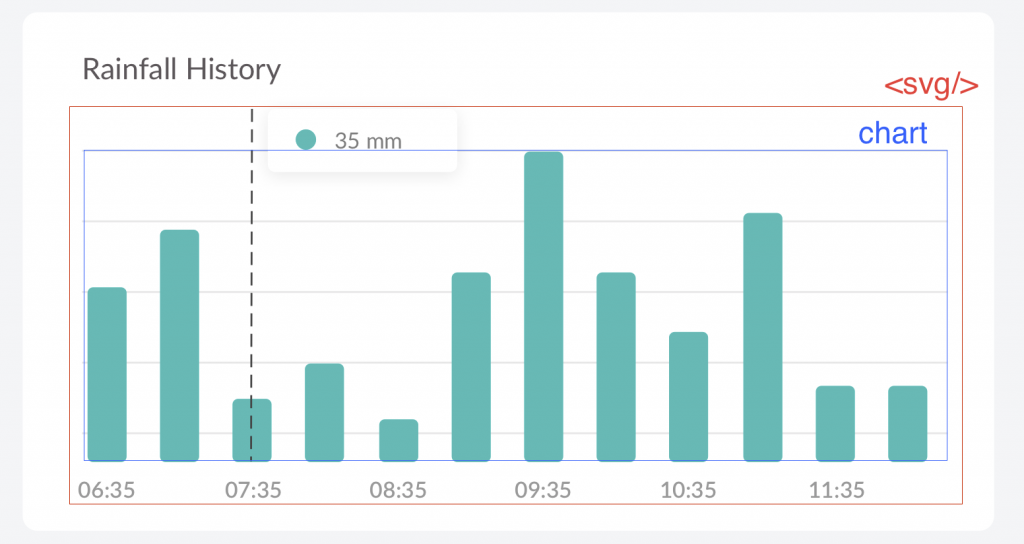
今天我們要來實作的是左下角的長條圖,在前面幾天我們已經做過長條圖了,相信對大家來說不是難事,只是讓大家體驗如果今天設計師出了一張圖表的設計圖,該如何高度還原這個設計稿,之後也會加上一些互動效果。
設計稿標示文件:https://yuanchen1103.github.io/2020ironman-weather-design/
首先我們先在components的資料夾裡面新增一個vue檔案 LineChart.vue,並先寫好init的東西。
接著在data加入一個keyid,並使用id產生器產生unique的值,並在template當中加入一個div且id為line-chart-${id},在這邊建立獨一無二id的原因是這個component也許未來會是共用的,到時候d3在選取元素時才能選到正確的元素。
在這邊分享一個生成短id的套件:https://www.npmjs.com/package/shortid
<template>
  <div :id="`line-chart-${id}`"></div>
</template>

<script>
import shortid from 'shortid';

export default {
  name: 'LineChart',
  data() {
    return {
      id: shortid.generate()
    }
  },
}
</script>
再來就是開始畫圖啦~在methods裡面定義一個drawChart(),並在mounted()時呼叫它。
提醒:不能在created()時呼叫,因為created()時dom還沒被掛載上去,如此一來d3會select不到dom
export default {
  name: 'LineChart',
  data() {
    return {
      id: shortid.generate()
    };
  },
  mounted() {
    this.drawChart();
  },
  methods: {
    drawChart() {}
  }
};
在開始畫長條圖之前,最重要的是先準備假資料,我們可以先定義好適合的資料格式,到時候串上api再把拿到的資料轉成這個格式。
const data = [
    {
      value: 10,
      name: '18:35'
    },
    {
      value: 12,
      name: '18:55'
    },
    // ...共12筆
  ];
大家不知道還記不記得怎麼畫長條圖,打開設計圖來看,我們先來畫綠色一條一條的柱子。(以下的程式都是寫在剛剛創建的drawChart()中)
通常我們不會讓長條圖的部分塞滿整個svg,因為周圍可能還要放一些像是圖示、標題、座標軸等東西,所以我們會先預設好長條圖與svg的比例。

const margin = {
    top: 20,
    bottom: 20,
    left: 10,
    right: 10
}
const chartWidth = 235 - margin.left - margin.right; // 235是整個svg的寬
const chartHeight = 105 - margin.top - margin.bottom; // 105是整個svg的高
const x = d3.scaleBand()
            .domain(data.map(e => e.name))
            .range([0, chartWidth])
            .paddingInner(0.4);
const y = d3.scaleLinear()
            .domain([0, d3.max(data.map(e => e.value))])
            .range([chartHeight, 0]);
// 選取div並加入svg
const svg = d3
    .select(`#line-chart-${this.id}`)
    .append('svg')
    .attr('width', chartWidth + margin.left + margin.right)
    .attr('height', chartHeight + margin.top + margin.bottom);

// 在svg中加入一個g並移到svg中間
const g = svg.append('g').attr('transform', `translate(${margin.left}, ${margin.top})`);

// 在g畫上柱體
g
    .selectAll('rect')
    .data(data)
    .enter()
    .append('rect')
    .attr('x', d => x(d.name))
    .attr('y', d => y(d.value))
    .attr('width', x.bandwidth)
    .attr('height', d => chartHeight - y(d.value))
    .attr('fill', '#00BAB6')
    .attr('rx', 3);
這樣就成功把柱體都畫好了
明天我們將會加上底下的時間文字跟後方的標示線。
附上今天進度的git commit:
https://github.com/yuanchen1103/2020ironman-weather/commit/e6bc59416900beb8c969fd133123db2c7d0b388e
