昨天我們幫圖表加上了一點進場動畫,因為座標軸沒有明確的數字,所以我們今天要加上hover圖表的提示(tooltip),也多了一點互動效果。
設計稿標示文件:https://yuanchen1103.github.io/2020ironman-weather-design/
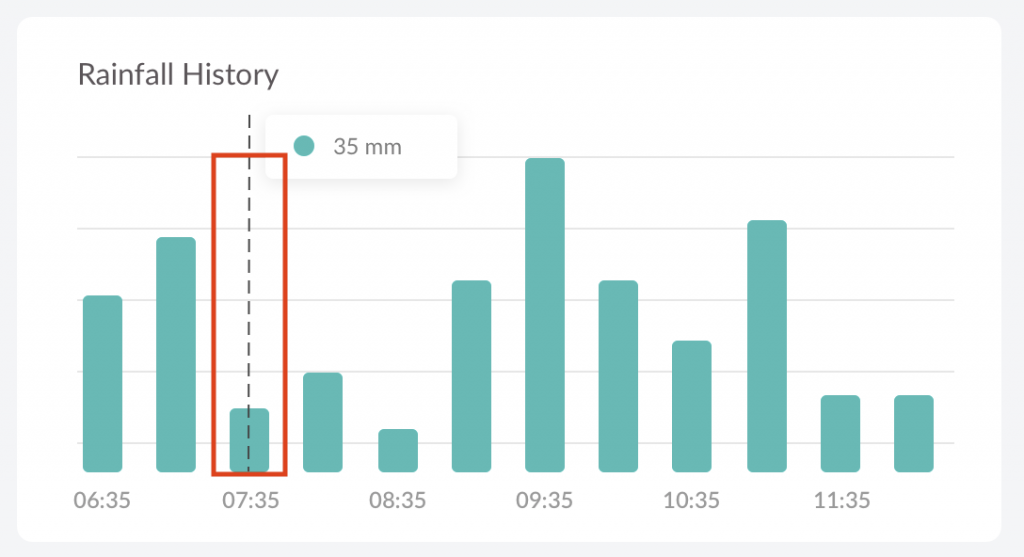
看著設計稿卻沒有靈感要如何實作嗎?先觀察一下設計圖並拆解一下:
這個東西可拆成
那要怎麼讓這個東西出現呢?我們希望滑鼠在hover上紅框的範圍都能觸發tooltip,所以我們可以建立好幾個透明的長方形,在hover上不同長方形的時候觸發畫出tooltip的事件。
首先我們先來做觸發事件的區塊。
在那之前先去把之前長條圖的rect加上class,並改用class做選擇d3.selectAll('rect') => d3.selectAll('.bar'),才不會跟現在要新增的方形打架。
觀察一下上面那個圖,一個區塊的寬度為
柱體的寬度 + 2 * (1 / 2 * 間距) = 柱體的寬度 + 間距 = step
高度很簡單為chartHeight,知道了就開始畫圖吧~
g
    .selectAll('.hover-block')
    .data(data)
    .enter()
    .append('rect')
    .attr('class', 'hover-block')
    .attr('width', x.step)
    .attr('height', chartHeight)
    .attr('fill', 'transparent')
    //x為柱體的x 減 二分之一間距
    .attr('x', d => x(d.name) - ((x.step() - x.bandwidth()) / 2))
    // 加上滑鼠監聽事件
    .on('mouseover', (d, i) => {
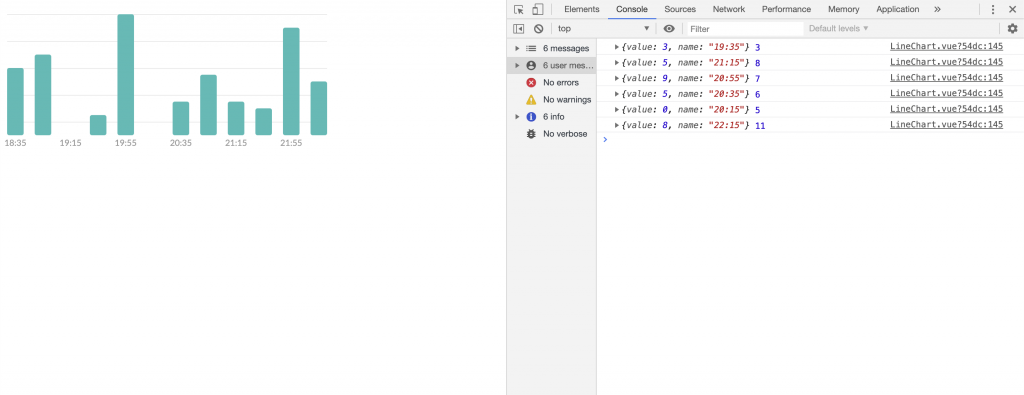
      console.log(d, i); // 用console來測試看看
    });

摁!看起來沒什麼問題。再來只剩下放上tooltip了,tooltip因為一次只會出現一組,所以都只要各做一個就行,到時候再動態改變位置跟內容。
首先先加上黑色虛線:
const dashLine = g
    .append('line')
    .attr('class', 'dash-line')
    .attr('y1', 0)
    .attr('y2', chartHeight)
    .attr('stroke', '#454545')
    .attr('stroke-width', 1)
    .attr('stroke-dasharray', 8)
    .attr('opacity', 0); // 一開始先藏起來
再來加上訊息框,因為這個訊息框內容比較複雜,加上svg裡面的元素要加上陰影比較麻煩,所以我們這邊直接用div呈現,記得要加在<svg/>的外面,不然會無法顯示:
// 先在svg外的div加上position relative的style,這樣等一下我們才能在裡面用absolute做定位
<template>
  <div :id="`line-chart-${id}`" style="position: relative;"></div>
</template>
const messageWrapper = d3
    .select(`#line-chart-${this.id}`)
    .append('div')
    .html()
    .attr('class', 'message-wrapper') //指定class以後直接去css寫樣式比較快
    //在div裡面先寫好html,data是我們之後要塞數字的地方
    .html('<div class="circle"></div><div class="data"></div>')
    .attr('style', 'display: none;'); // 一開始先藏起來
再來就是重頭戲,剛剛我們不是有做好一個監聽事件嗎?在那裡面把tooltip內容定好並顯示就完成囉~
.on('mouseover', (d, i) => {
  dashLine
    .attr('x1', () => x(d.name) + x.bandwidth() / 2) //設定虛線位置
    .attr('x2', () => x(d.name) + x.bandwidth() / 2)
    .attr('opacity', 1); //顯示虛線

  d3.select('.message-wrapper .data').html(`${d.value} mm`); //塞進data value

  messageWrapper
    .attr('style', () => `display: flex; left: ${x(d.name) + 30}px`); //設定div位置並顯示
})
.on('mouseleave', (d, i) => {
  dashLine.attr('opacity', 0);
  messageWrapper.attr('style', 'display: none;');
});

終於把這個圖表完成了~其實只要把設計圖一個一個拆解開就不會覺得很複雜,我自己覺得畫d3最麻煩的地方就是在算那些x跟y的位置,仔細思考過後也沒有那麼難喔!
明天開始就會開始做折線圖,有了這個基礎以後是小case啦
今日進度commit: https://github.com/yuanchen1103/2020ironman-weather/commit/d643916e3a084b8be08ad8a4bb2df1defba69c76
