
一般來說,學習Deep learning都會從最簡單的Linear regression開始。而在實務上,當我們有一個簡單的預測數值的case,Ex: 股價、人數...等。或許就會使用簡單的線性迴歸或者羅吉斯回歸來使用。它除了簡單且可解釋。因此,有時候會被當作bechmark或者或者第一個嘗試的模型。當然,現在很多都直接使用XGB、RF等Machine learning做為第一個嘗試模型,這些模型有許多優點,可以減少部分資料前處理麻煩,且效果也都還不錯 (絕對不是因為懶)。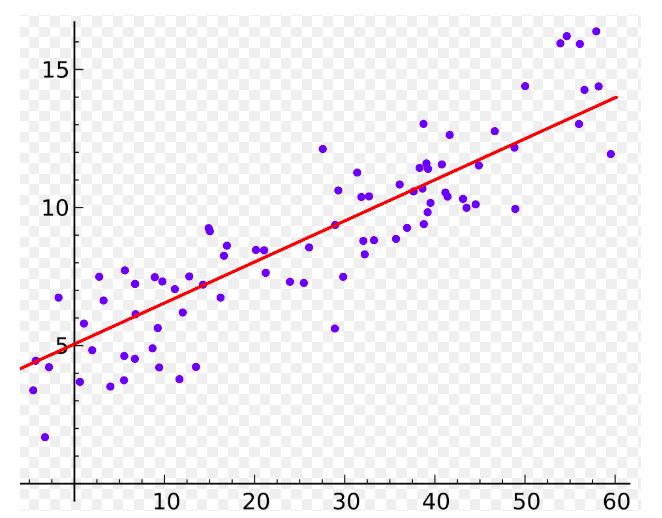
Source
什麼是Linear regression
簡單來說,找出符合資料規律的直線,即為線性迴歸。線性迴歸主要利用自變數(X)來預測依變數(Y)。一般來說,線性回歸有許多方式求解,像是我們在大學有學過公式解。其中公式解其實就利用最小平方法來求解。而最小平方法其目的就是希望透過觀察值與預測值差異的平方和最小化。因此透過loss function的設定及微分求導,可以得到一般所看到的公式解。
而當資料太大時,公式解可能就不會是一個有效率的解法,因此,一般來說都會改用gradient desent求解找出最佳的權重。
Simple Linear regression
Simple linear regression就是在二維平面上找出一個,能代表資料的一條直線,接下來我們會用TF來簡單跑一個simple linear regression。
首先,我們先在製造一些fake data,以及先define W以及b。
#Create dataset
X = np.random.rand(n_samples).astype(np.float32)
Y = X * 10 + 5
W = tf.Variable(tf.random.normal([1]))
b = tf.Variable(tf.zeros([1]))
這樣的設定,也表示說,等等所跑出來的W以及b需要非常接近10和5才能說這個Linear regression是成功的。
接下來Define linear regression以及其loss function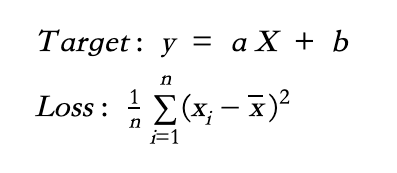
#Define LR and Loss function (MSE)
def linear_regression(x):
    return W * x + b

def mean_square(y_pred, y_true):
    return tf.reduce_sum(tf.pow(y_pred-y_true, 2)) / (2 * n_samples)

# Stochastic Gradient Descent Optimizer.
optimizer = tf.optimizers.SGD(learning_rate)
這邊的optimizer就使用的就是SGD,tf裡面的api就有可以直接包好的Stochasric Gradient Descent。之後,會在詳細的介紹其他常用optimizer (Ex: adam ) 。
def run_optimization():
    # Wrap computation inside a GradientTape for automatic differentiation.
    with tf.GradientTape() as g:
        pred = linear_regression(X)
        loss = mean_square(pred, Y)

    # Compute gradients.
    gradients = g.gradient(loss, [W, b])

    # Update W and b following gradients.
    optimizer.apply_gradients(zip(gradients, [W, b]))
在tf2.0裡若想要自動計算gradient的話,一般來說都會使用gradienttape這個函數,可以參考這篇GradientTape_Tutorials。
最後就直接以For來run整個Model
for step in range(1, training_steps + 1):
    # Run the optimization to update W and b values.
    run_optimization()
    if step % display_step == 0:
        pred = linear_regression(X)
        loss = mean_square(pred, Y)
        print("step: %i, loss: %f, W: %f, b: %f" % (step, loss, W.numpy(), b.numpy()))
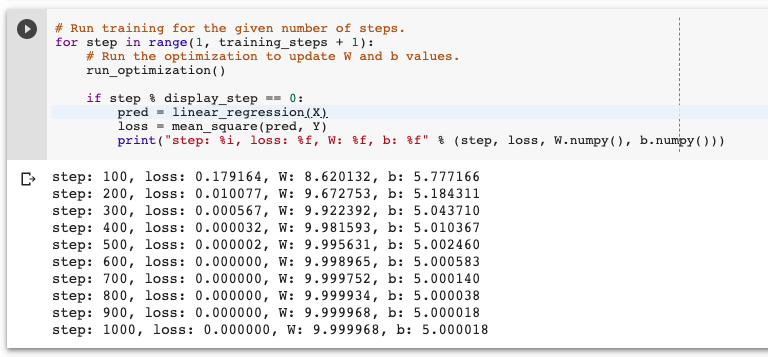
最後,我們可以畫出結果,可以發現學習的結果,非常接近一開始我們所假定的W和b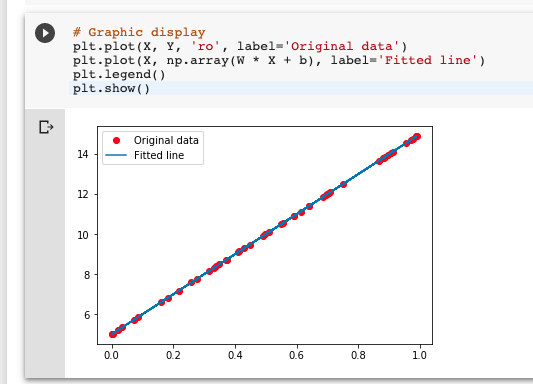
小結:
感謝大家漫長的閱讀,若有問題都可以留言交流。今天開始最基本的Linear regression,這次並沒有使用像是房價或者股價等案例來跑,是希望這樣能更清楚了解基本的模型,未來會選擇一些有趣的data 來玩。備註有TF2.0跟TF1.X的程式,大家可以比較看看。
感謝大家!
一天一梗圖:
Source
備註:
很實用的文章!
另想請問最後一段程式碼中的display_step是從哪宣告呢?
而if step % display_step == 0:這段代表什麼意思呢?
謝謝~
display_step 一開始宣告,原po是設 100if step % display_step == 0:
這裡是指每 100 次把 loss, W 和 b 印出來
過程中遇到的問題,供其他人參考
optimizer = tf.keras.optimizers.SGD(learning_rate)
'RefVariable' object has no attribute '_id'
https://stackoverflow.com/questions/57250679/refvariable-object-has-no-attribute-id

 iThome鐵人賽