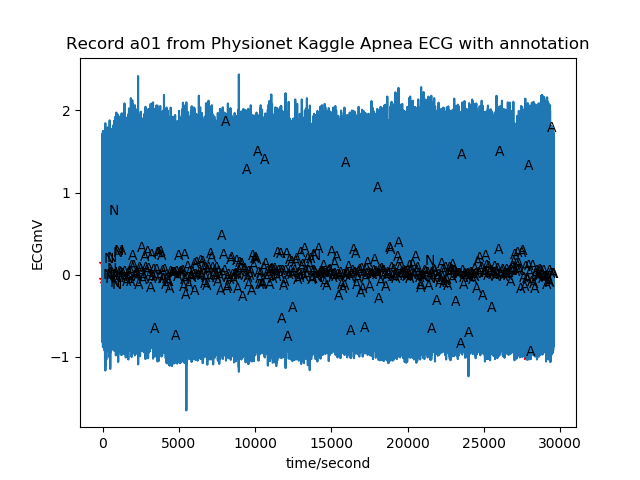
接上文, 當dataset download下來之後, 可以用下列的程式標出annotation, 也就是醫生的註解, 幫助我們了解疾病與心電圖之間的關係, 之後當然要用AI算法來訓練並預測發生的機率, 這裡就留給讀者來實驗了, 說不一定kaggle上的競賽,如果有拿第一名, 會被google聘用也不一定!
import numpy as np

record = wfdb.rdrecord(record_name='a01' ,channels=None, physical=True, pb_dir=None, m2s=True, smooth_frames=True, ignore_skew=False, return_res=16, force_channels=True, channel_names=None, warn_empty=False)
ann = wfdb.rdann('a01', 'apn' )


wfdb.plot_wfdb(record=record, annotation=ann, plot_sym=True, time_units='seconds', title='Record a01 from Physionet Kaggle Apnea ECG with annotation')

wfdb.show_ann_labels();

下列列出所有annotation的定義, a01的紀錄以N跟A比較多:
0 0 Not an actual annotation
1 1 N Normal beat
2 2 L Left bundle branch block beat
3 3 R Right bundle branch block beat
4 4 a Aberrated atrial premature beat
5 5 V Premature ventricular contraction
6 6 F Fusion of ventricular and normal beat
7 7 J Nodal (junctional) premature beat
8 8 A Atrial premature contraction
9 9 S Premature or ectopic supraventricular beat
10 10 E Ventricular escape beat
11 11 j Nodal (junctional) escape beat
12 12 / Paced beat
13 13 Q Unclassifiable beat
14 14 ~ Signal quality change
16 16 | Isolated QRS-like artifact
18 18 s ST change
19 19 T T-wave change
20 20 * Systole
21 21 D Diastole
22 22 " Comment annotation
23 23 = Measurement annotation
24 24 p P-wave peak
25 25 B Left or right bundle branch block
26 26 ^ Non-conducted pacer spike
27 27 t T-wave peak
28 28 + Rhythm change
29 29 u U-wave peak
30 30 ? Learning
31 31 ! Ventricular flutter wave
32 32 [ Start of ventricular flutter/fibrillation
33 33 ] End of ventricular flutter/fibrillation
34 34 e Atrial escape beat
35 35 n Supraventricular escape beat
36 36 @ Link to external data (aux_note contains URL)
37 37 x Non-conducted P-wave (blocked APB)
38 38 f Fusion of paced and normal beat
39 39 ( Waveform onset
40 40 ) Waveform end
41 41 r R-on-T premature ventricular contraction
