今天的目標
把其中隨機3個溺水的女性找出來!
並且在圖上標示出來
library(titanic)
library(ggplot2)

raw = titanic_train

ggplot(raw,aes(x = Age , y = Survived)) +
  geom_point(aes(color = Sex)) +
  geom_text(label = raw$Name)
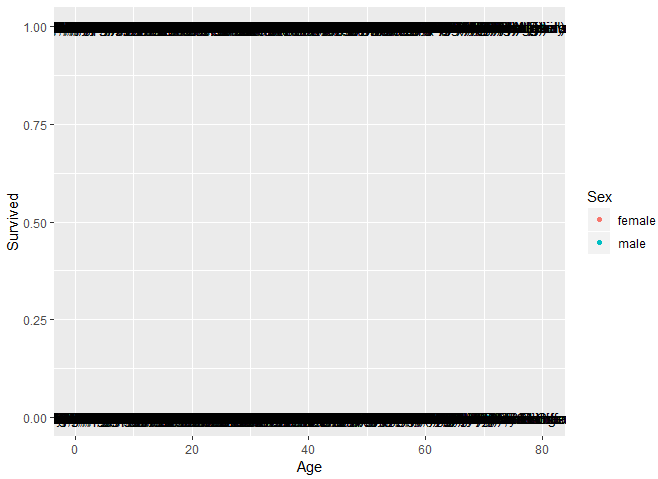
這樣畫的話 , 會很恐怖
會把全部人都畫出來了
所以要先把目標資料挑出來
target = subset(raw,Survived == 0 & Sex == "female")
然後隨機找三個人
target = target[sample(50)[1:3],]
在來繪製在圖上
ggplot(raw,aes(x = Age , y = Survived)) +
  geom_point(aes(color = Sex)) +
  geom_label(data = target ,label = target$Name ,position = "identity")
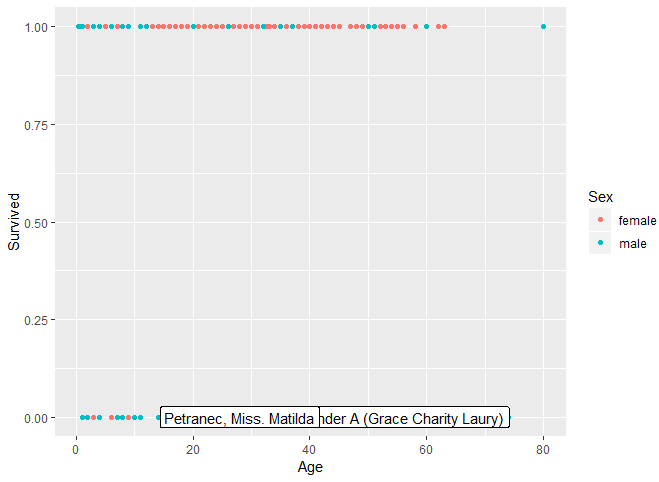
即可完成!!

 iThome鐵人賽