在昨天已經可以使用terminal(終端機)的方式印出我們的股價資料,可是terminal很難做觀察,有沒有比較好的方式呢?Jupyter Notebook是個好選擇!
(本範例檔案:Day7_getStockFromYahoo.ipynb)
最簡單來說,Jupyter Notebook 就是可以讓Python 簡單圖形化的工具!
從Visual Studio Code的安裝教學文件中有說明:
Jupyter (formerly IPython Notebook) is an open-source project that lets you easily combine Markdown text and executable Python source code on one canvas called a notebook.
也就是說Jupyter 是一個open-source 的專案,可以簡單地執行並呈現Python,換而言之,就是一個呈現Python結果的工具。更多說明可以參考WIKI。
VS Code建議我們安裝Anaconda,可是這個太大包了,裡面裝一堆我們用不到的東西,所以我偏向不裝這個,而是善用pipenv(或是pip)逐一安裝我們需要的東西。現在就是開始安裝我們的Jupyter囉!
pipenv install jupyter
這樣就安裝完囉
首先,我們先開啟Jupyter的檔案,副檔名會是.ipynb。打開 Command Palette (⇧⌘P) (可參考教學文章)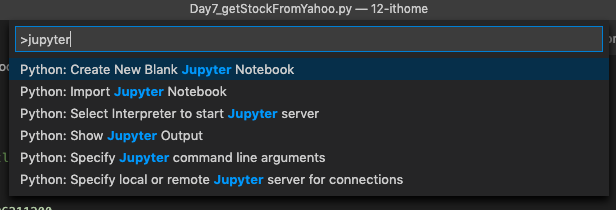
(如果打不開的話,記得檢查執行環境,是否是我們的pipenv,如果不是的話要進行更換:Python: Select Interpreter)
開啟Jupyter的檔案後,我們不免俗的也用hello world來檢查是否能正常顯示吧。
print("Hello world! Python & Jupyter")
print("By Eyelash")
輸入完畢,點擊旁邊的播放按鈕,接著就會跑囉!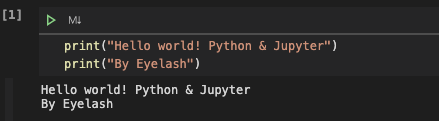
Jupyter Notebook有個特色,就是可以選擇性去跑程式。一般來說我們都是上到下的逐行去執行,無法跳躍去執行,像是我現在已經從第一行跑到第十行,但現在又想要重新執行第三行,在Jupyter Notebook的世界,是可以回到第三行,再按下執行紐,就可以囉!這可以讓資料重新抓,不用重新跑(不過有時候手殘,會讓資料錯亂@@)
在執行之前,需要有個套件來進行繪圖,也就是我們的繪圖大神matplotlib(要執行pipenv install matplotlib)。安裝完畢後,把前幾天一直使用的股票資料放進去:
import requests
import json
import numpy
import pandas
# import matplotlib

# API位置
start_time = 1596211200
end_time = 1599926400
address = f"https://query1.finance.yahoo.com/v8/finance/chart/2317.TW?period1={start_time}&period2={end_time}&interval=1d&events=history&=hP2rOschxO0"

# 使用requests 來跟遠端 API server 索取資料
response = requests.get(address)

# 序列化資料回報
data = json.loads(response.text)

# 把json格式資料放入pandas中
df = pandas.DataFrame(
    data["chart"]["result"][0]["indicators"]["quote"][0],
    index=pandas.to_datetime(
        numpy.array(data["chart"]["result"][0]["timestamp"]) * 1000 * 1000 * 1000
    ),
)
# 印出前3行
print(df[:3])
# 印出前5行
print(df.head())

# 印出圖表
df.close.plot()
在我的VS Code會分成這幾個群組,方便我隨時修改資料並執行: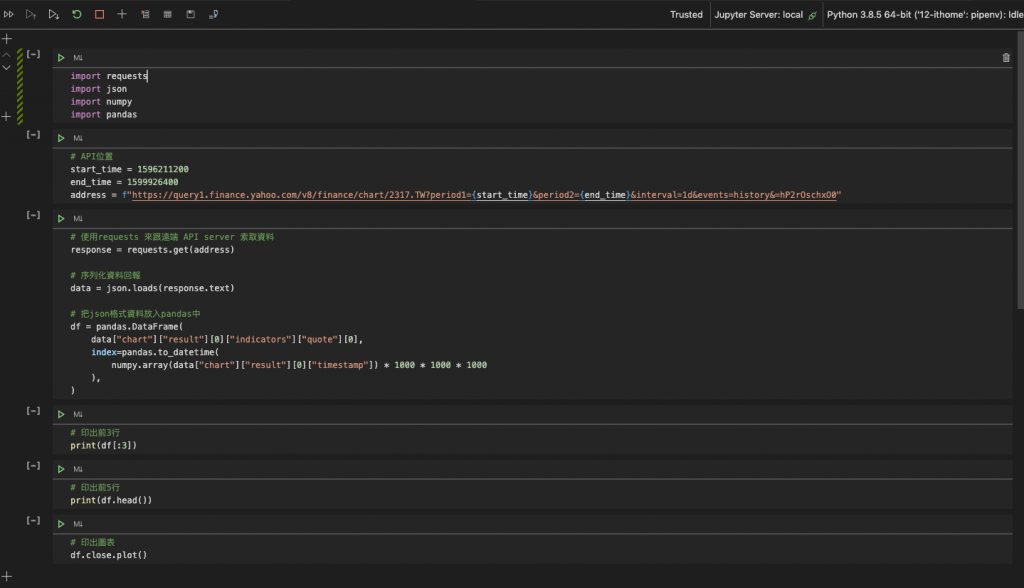
執行我們所有程式,在最後一行df.close.plot(),會把我們的資料呈現出來囉!他就會是一個漂亮的圖表,可以很清楚的看出來股價走勢圖,比之前的表格更容易閱讀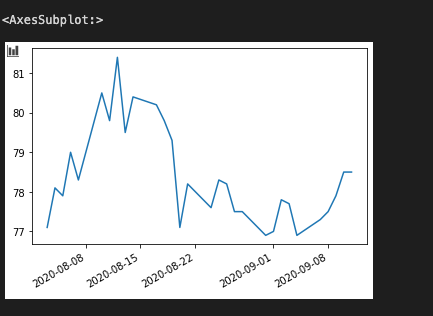
忘記表格了嗎?我們再回憶一下,回到Day6。
參考資料: