學習如何將數據化為折線圖,將使用 Matplotlib 模組來繪製
Matplotlib 是 Python 在 2D 繪圖範疇上使用最廣泛的模組,可以讓開發者快速請簡易的將資料圖形化,並且提供許多樣式的輸出格式
在使用之前,需先安裝 Matplotlib,若是 Anacoda 安裝的環境則不用再安裝,因預設上已經安裝
pip install matplotlib
在這邊因大部分的繪製功能都在 matplotlib.pyplot 裡,為求等等撰寫方便,取個別名為 plt
import matplotlib.pyplot as plt
折線圖是以 plot 函式繪製,使用語法為:
plt.plot(x座標串列值, y座標串列值, [其餘參數值])
後續將講解如何使用及其餘參數有哪些,在此需先把 x座標串列值及 y座標串列值,先建立好:
x = [1, 5, 9, 13, 17]
y = [5, 30, 15, 35, 5]
接著套入語法裡,並設定顏色為紅色
plt.plot(x, y, color='red')
然後設定 x 軸標題及 y 軸標題標題,並呈現出來
plt.xlabel('x label') # 設定 x 軸標題
plt.ylabel('y label') # 設定 y 軸標題
plt.show()
結果如下: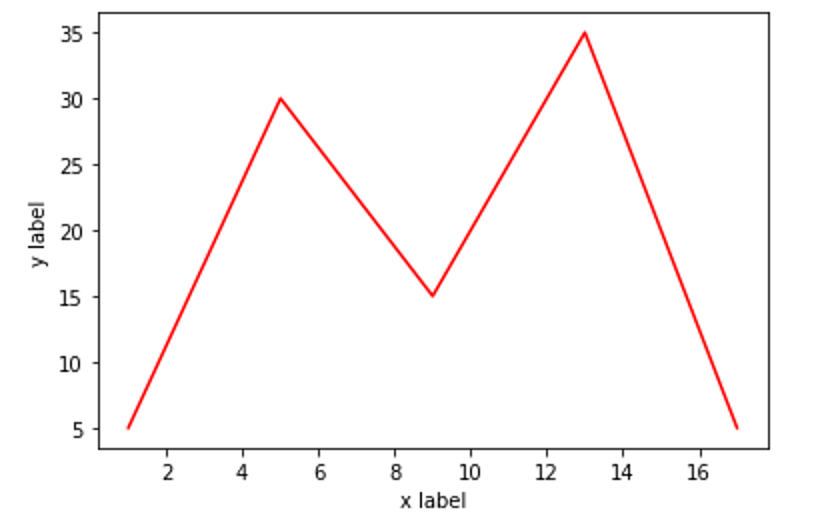
上述有提到還有許多關於線條的其他參數,這邊就依序來介紹一下
| 參數 | 說明 | Example |
|---|---|---|
| linewidth 縮寫 lw | 設定線條寬度,預設為 1.0 | linewidth=3.0 |
| color | 設定線條顏色 | color="red" |
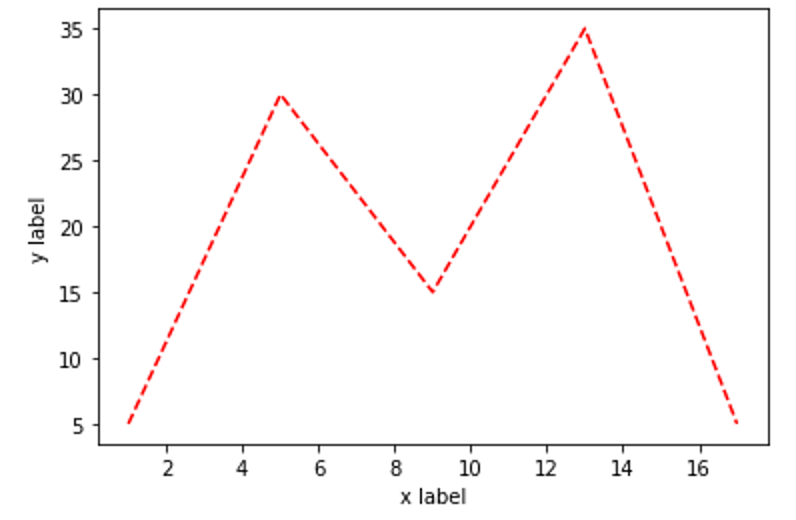
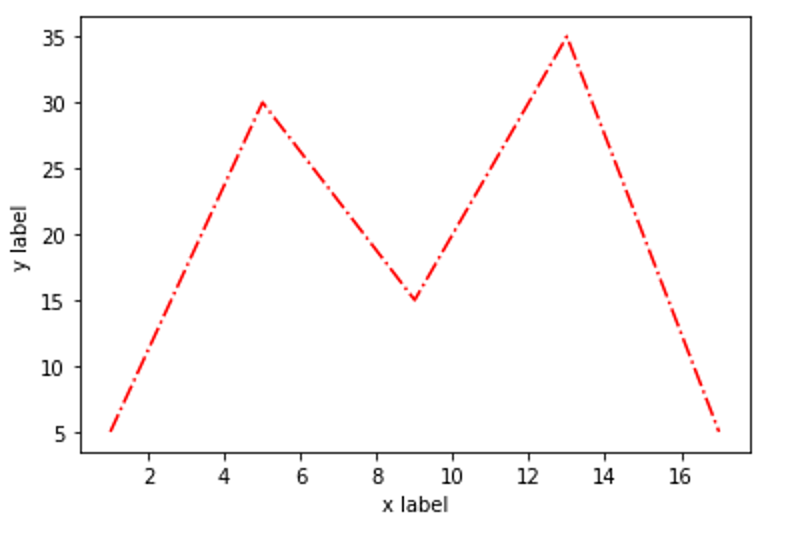
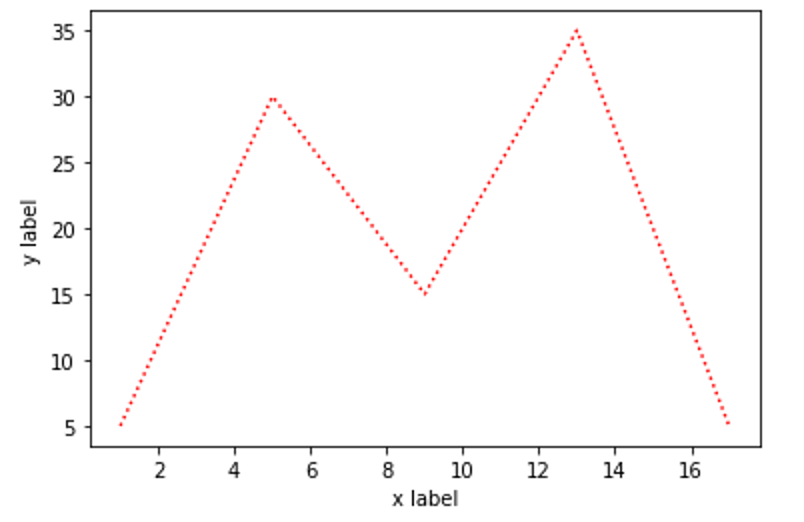
| linestyle 縮寫 ls | 設定線條樣式,設定值有實線「-」、虛線「--」、虛點線「-.」、點線「:」 | linestyle="-." |
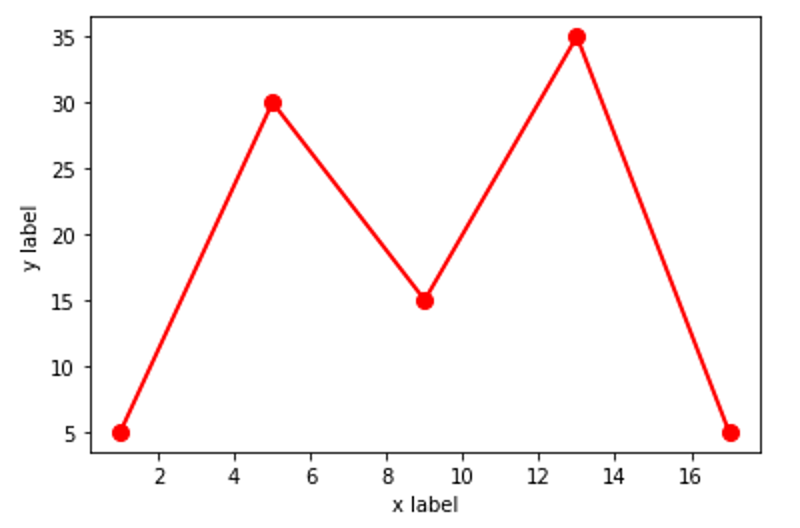
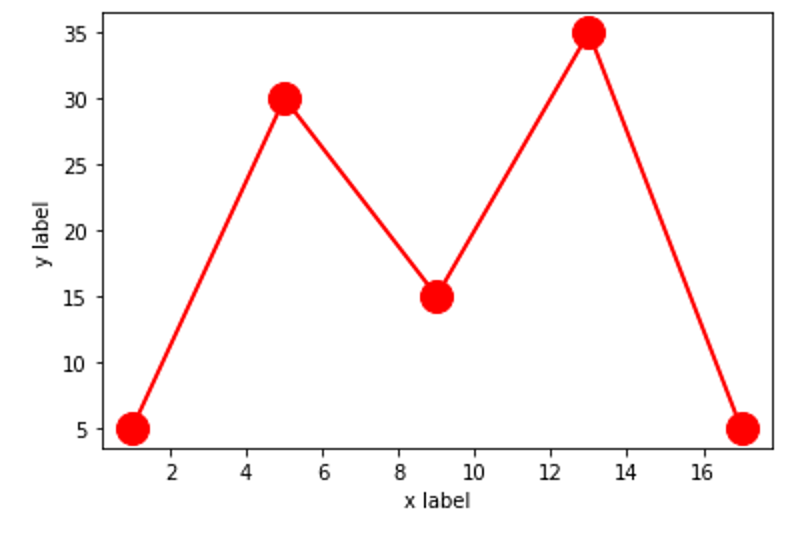
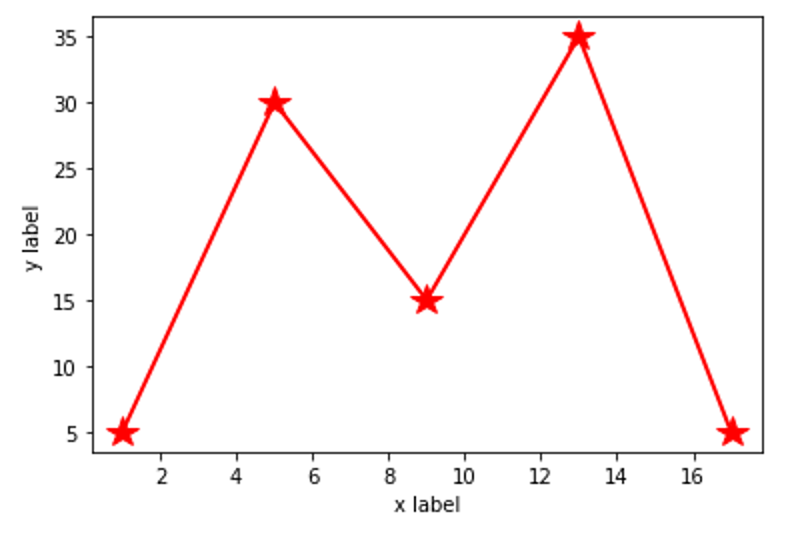
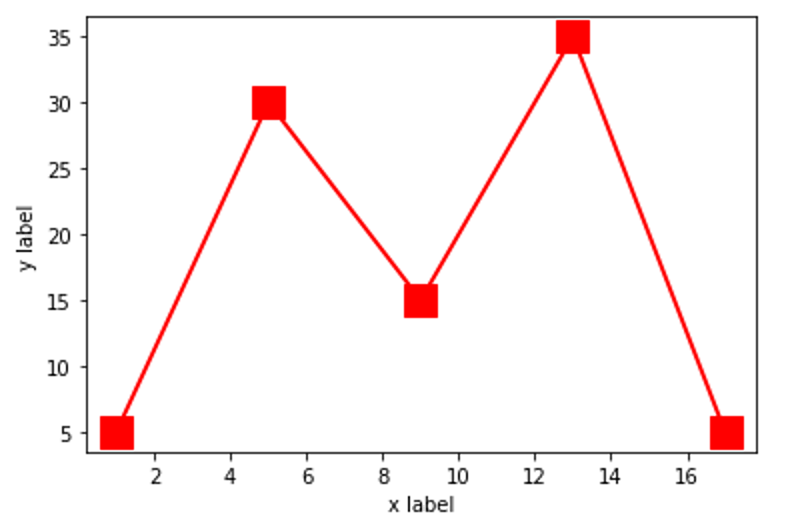
| marker | 設定標記樣式,可設定的值有很多,這邊僅取幾個較常用的,「. 點」、「o 圓」、「* 星」、「s 矩形」 | marker="*" |
| markersize 縮寫 ms | 標記大小 | ms=16 |
| label | 設定圖例名稱,需搭配 legend 函式才有效果 | label="Test" |
plt.plot(x, y, color='red', linestyle="--")
plt.plot(x, y, color='red', linestyle="-.")
plt.plot(x, y, color='red', linestyle=":")
因為需要展示出效果,因此把 linestyle 設為實線,linewidth 為 2.0,markersize 設為 16
plt.plot(x, y, color='red', linestyle="-", linewidth="2", markersize="16", marker=".")
plt.plot(x, y, color='red', linestyle="-", linewidth="2", markersize="16", marker="o")
plt.plot(x, y, color='red', linestyle="-", linewidth="2", markersize="16", marker="*")
plt.plot(x, y, color='red', linestyle="-", linewidth="2", markersize="16", marker="s")
圖表名稱的設定方法:
plt.title('名稱', 字體大小)
上述說到 x, y 軸標題的設定,都可以再加上設定字體大小,Code 如下:
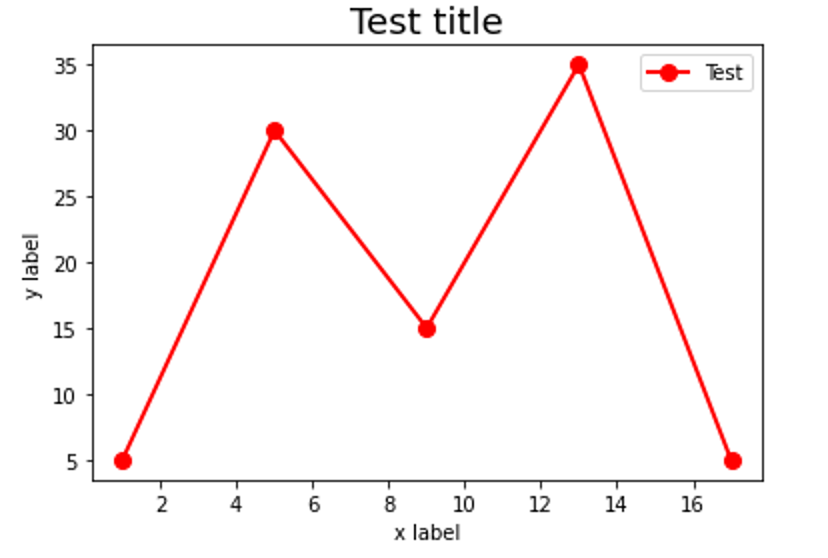
plt.plot(x, y, color='red', linestyle="-", linewidth="2", markersize="16", marker=".", label="Test")

plt.xlabel('x label', fontsize="10")
plt.ylabel('y label', fontsize="10")
plt.title('Test title', fontsize="18")
plt.xlim(起始值, 終止值)
plt.ylim(起始值, 終止值)
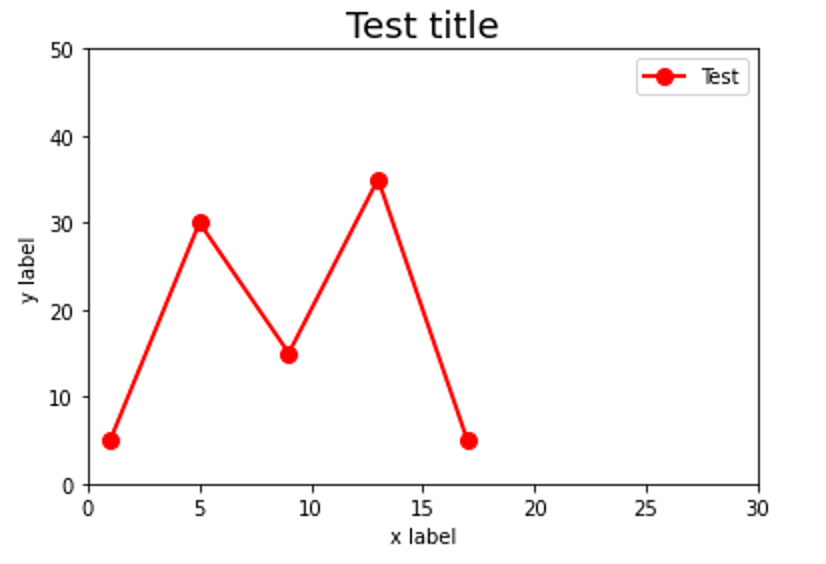
以上述範例做基礎,設定 x, y 軸座標範圍
plt.xlim(0, 30) # 設定 x 軸座標範圍
plt.ylim(0, 50) # 設定 y 軸座標範圍
這邊提供兩組 x, y 數值,請使用折線圖呈現出來
第一組條件:繪製折線圖,顏色「紅色」,線條樣式「-」,線條寬度「2」,標記大小「16」,標記樣式「.」,圖例名稱「Plot 1」
第二組條件:繪製折線圖,顏色「藍色」,線條樣式「-」,線條寬度「2」,標記大小「16」,標記樣式「.」,圖例名稱「Plot 2」
設定 x 軸座標範圍 0~30
設定 y 軸座標範圍 0~50
設定 x 軸標題為「x label」及大小「10」
設定 y 軸標題為「y label」及大小「10」
設定圖表標題為「Plot title」及大小「18」
完整代碼
import matplotlib.pyplot as plt

x1 = [1, 5, 9, 13, 17]
y1 = [5, 30, 15, 35, 5]
# 繪製折線圖,顏色「紅色」,線條樣式「-」,線條寬度「2」,標記大小「16」,標記樣式「.」,圖例名稱「Plot 1」
plt.plot(x1, y1, color='red', linestyle="-", linewidth="2", markersize="16", marker=".", label="Plot 1")

x2 = [3, 8, 12, 16, 20]
y2 = [8, 33, 18, 38, 8]
# 繪製折線圖,顏色「藍色」,線條樣式「-」,線條寬度「2」,標記大小「16」,標記樣式「.」,圖例名稱「Plot 2」
plt.plot(x2, y2, color='blue', linestyle="-", linewidth="2", markersize="16", marker=".", label="Plot 2")

plt.xlim(0, 30) # 設定 x 軸座標範圍
plt.ylim(0, 50) # 設定 y 軸座標範圍

plt.xlabel('x label', fontsize="10") # 設定 x 軸標題內容及大小
plt.ylabel('y label', fontsize="10") # 設定 y 軸標題內容及大小
plt.title('Plot title', fontsize="18") # 設定圖表標題內容及大小

plt.legend()
plt.show()
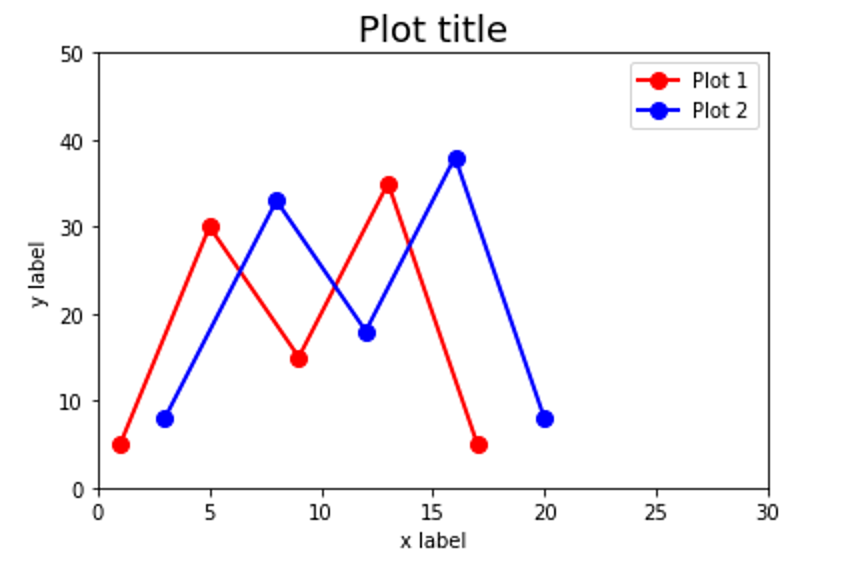
讓數據視覺化,可使觀看者更方便閱讀與分析,並且可以一目瞭然數據差異
上述說明與實作,已化簡掉許多內容,以便達到可讓初學習 Python 的初心者好上手
若是對其他未寫道的內容感興趣,可以自行上 Google 搜尋關鍵字「Python 繪製圖表」應該就會有許多更進階的介紹了
