接續前一天文章,今天來提到長條圖跟圓餅圖
長條圖是使用 bar 函數繪製出來的,語法為:
plt.bar(x座標串列值, y座標串列值, [其餘參數值])
其餘參數介紹:
| bar參數 | 說明 |
|---|---|
| width | 長條寬度,預設為 0.8 |
| color | 顏色 ('blue', 'red', 'green', 'yellow', 色碼('#CC00CC')),預設為藍色 blue |
| label | 圖例名稱,需搭配 legend 函式才有效果 |
| bottom | y 軸基底座標,預設為 0 |
實際操作
Step 1. 導入模組
import matplotlib.pyplot as plt
Step 2. 設定將使用的數值
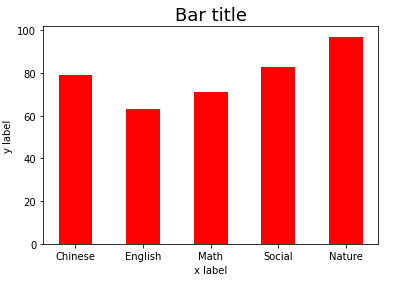
x = ['Chinese', 'English', 'Math', 'Social', 'Nature']
y = [79, 63, 71, 83, 97]
Step 3. 繪製出垂直 Bar,這邊使用的是 bar 函數,設定的是 width 寬度
plt.bar(x, y, width=0.5, color='red')
Step 4. 設定 x, y 及圖表標題
plt.xlabel('x label', fontsize="10") # 設定 x 軸標題內容及大小
plt.ylabel('y label', fontsize="10") # 設定 y 軸標題標題內容及大小
plt.title('Bar title', fontsize="18") # 設定圖表標題內容及大小
Step 5. 將圖表顯示出來
plt.show()
完整代碼:
import matplotlib.pyplot as plt

x = ['Chinese', 'English', 'Math', 'Social', 'Nature']
y = [79, 63, 71, 83, 97]
plt.bar(x, y, width=0.5, color='red')

plt.xlabel('x label', fontsize="10") # 設定 x 軸標題內容及大小
plt.ylabel('y label', fontsize="10") # 設定 y 軸標題標題內容及大小
plt.title('Bar title', fontsize="18") # 設定圖表標題內容及大小

水平長條圖是使用 barh 函數繪製出來的,語法為:
plt.barh(x座標串列值, y座標串列值, [其餘參數值])
其餘參數介紹:
| barh參數 | 說明 |
|---|---|
| height | 長條高度,預設為 0.8 |
| color | 顏色 ('blue', 'red', 'green', 'yellow', 色碼('#CC00CC')),預設為藍色 blue |
| label | 圖例名稱,需搭配 legend 函式才有效果 |
| bottom | y 軸基底座標,預設為 0 |
實際操作
Step 1. 導入模組
import matplotlib.pyplot as plt
Step 2. 設定將使用的數值
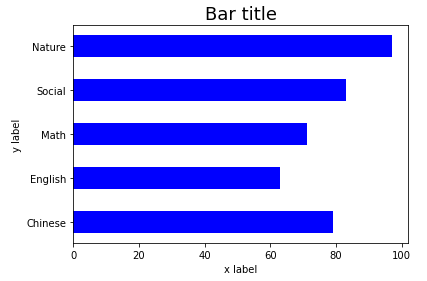
x = ['Chinese', 'English', 'Math', 'Social', 'Nature']
y = [79, 63, 71, 83, 97]
Step 3. 繪製出水平 Bar,這邊使用的是 barh 函數,設定的是 height 寬度
plt.barh(x, y, height=0.5, color='blue')
Step 4. 設定 x, y 及圖表標題
plt.xlabel('x label', fontsize="10") # 設定 x 軸標題內容及大小
plt.ylabel('y label', fontsize="10") # 設定 y 軸標題標題內容及大小
plt.title('Bar title', fontsize="18") # 設定圖表標題內容及大小
Step 5. 將圖表顯示出來
plt.show()
完整代碼:
import matplotlib.pyplot as plt

x = ['Chinese', 'English', 'Math', 'Social', 'Nature']
y = [79, 63, 71, 83, 97]
plt.barh(x, y, height=0.5, color='blue')

plt.xlabel('x label', fontsize="10") # 設定 x 軸標題內容及大小
plt.ylabel('y label', fontsize="10") # 設定 y 軸標題標題內容及大小
plt.title('Bar title', fontsize="18") # 設定圖表標題內容及大小

plt.show()

疊加長條圖是繪製出兩個長條圖,並以推疊的方式繪製而出的
實際操作
Step 1. 導入模組
import matplotlib.pyplot as plt
Step 2. 設定將使用的數值,因為這邊需要兩組數值,因此有 y1, y2
x = ['Chinese', 'English', 'Math', 'Social', 'Nature']
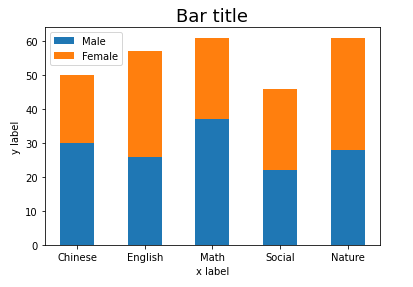
y1 = [30, 26, 37, 22, 28]
y2 = [20, 31, 24, 24, 33]
Step 3. 將兩條長條圖繪製出來,其中第二條 y2 的 y 軸基底座標是建立在 y1 上
plt.bar(x, y1, width=0.5, label='Male')
plt.bar(x, y2, width=0.5, bottom=y1, label='Female')
Step 4. 設定 x, y 及圖表標題
plt.xlabel('x label', fontsize="10") # 設定 x 軸標題內容及大小
plt.ylabel('y label', fontsize="10") # 設定 y 軸標題標題內容及大小
plt.title('Bar title', fontsize="18") # 設定圖表標題內容及大小
Step 5. 將圖表顯示出來,並顯示圖例名稱
plt.legend()
plt.show()
完整代碼:
import matplotlib.pyplot as plt

x = ['Chinese', 'English', 'Math', 'Social', 'Nature']
y1 = [30, 26, 37, 22, 28]
y2 = [20, 31, 24, 24, 33]
plt.bar(x, y1, width=0.5, label='Male')
plt.bar(x, y2, width=0.5, bottom=y1, label='Female')

plt.xlabel('x label', fontsize="10") # 設定 x 軸標題內容及大小
plt.ylabel('y label', fontsize="10") # 設定 y 軸標題標題內容及大小
plt.title('Bar title', fontsize="18") # 設定圖表標題內容及大小

plt.legend()
plt.show()

圓餅圖是使用 pie 函數繪製出來的,語法為:
plt.pie(串列資料, [其餘參數值])
其餘參數介紹:
| pie參數 | 說明 |
|---|---|
| color | 指定圓餅圖的顏色 ('blue', 'red', 'green', 'yellow', 色碼('#CC00CC')),預設為藍色 blue |
| label | 項目標題,需搭配 legend 函式才有效果 |
| explode | 設定分隔的區塊位置 |
| autopct | 項目百分比格式,語法為「%格式%%」,Example:autopct = "%2.2f%%"(表示整數2位數及小數點2位數) |
| pctdistance | 數值文字與圓心距離 |
| shadow | 圓餅圖陰影開啟/關閉,True 有陰影,False 沒有陰影 |
| startangle | 繪製起始角度,繪製會以逆時鐘旋轉計算角度 |
| radius | 圓餅圖的半徑,預設是1 |
實際操作
Step 1. 導入模組
import matplotlib.pyplot as plt
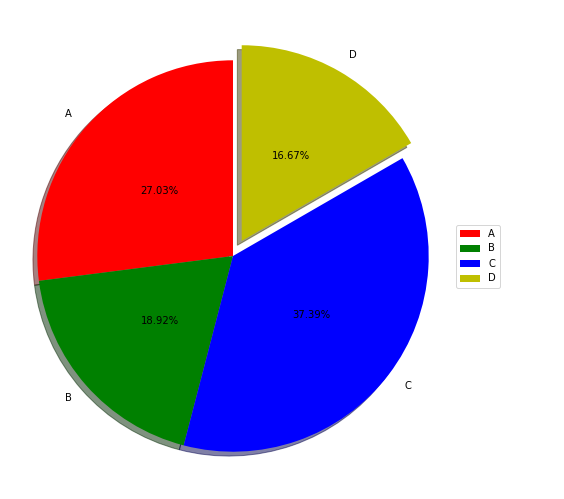
Step 2. 設定將使用的數值,將要有項目標題、數值串列、圓餅圖顏色、分隔的區塊位置
labels = ['A', 'B', 'C', 'D']
values = [60, 42, 83, 37]
colors = ['r', 'g', 'b', 'y']
explode = (0, 0, 0, 0.08)
Step 3. 設定圖表區寬高
plt.figure(figsize=(10,10)) # 設定圖表區寬高
Step 4. 設定 pie 函數參數繪製圓餅圖
plt.pie(
values, # 數值
labels = labels, # 項目標題
colors = colors, # 指定圓餅圖的顏色
explode = explode, # 設定分隔的區塊位置
autopct = "%2.2f%%", # 項目百分比格式
pctdistance = 0.5, # 數值文字與圓心距離
shadow = True, # 圓餅圖陰影開啟/關閉
startangle = 90, # 繪製起始角度
radius = 0.9 # 圓餅圖的半徑,預設是1
)
Step 5. 設定 legnd 的位置,將圖表顯示出來,並顯示圖例名稱
plt.legend(loc = "right") # 設定 legnd 的位置
plt.show()
完整代碼:
import matplotlib.pyplot as plt

labels = ['A', 'B', 'C', 'D']
values = [60, 42, 83, 37]
colors = ['r', 'g', 'b', 'y']
explode = (0, 0, 0, 0.08)

plt.figure(figsize=(10,10)) # 設定圖表區寬高

plt.pie(
values, # 數值
labels = labels, # 項目標題
colors = colors, # 指定圓餅圖的顏色
explode = explode, # 設定分隔的區塊位置
autopct = "%2.2f%%", # 項目百分比格式
pctdistance = 0.5, # 數值文字與圓心距離
shadow = True, # 圓餅圖陰影開啟/關閉
startangle = 90, # 繪製起始角度
radius = 0.9 # 圓餅圖的半徑,預設是1
)

plt.legend(loc = "right") # 設定 legnd 的位置
plt.show()

今天內容稍微有點多了,就到這一段落吧,明日來點實作好了
